Remove Business Intelligence Remove Dashboards Remove Presentation Remove Visualization
article thumbnail

What Is The Difference Between Business Intelligence And Analytics?

datapine

1) What Is Business Intelligence And Analytics? 4) How Do BI And BA Apply To Business? If someone puts you on the spot, could you tell him/her what the difference between business intelligence and analytics is? We already saw earlier this year the benefits of Business Intelligence and Business Analytics.

article thumbnail

Top Business Intelligence Features To Boost Your Business Performance

datapine

1) Benefits Of Business Intelligence Software. 2) Top Business Intelligence Features. c) Dashboard Features. Benefits Of Business Intelligence Software. 17 Top Features Of Business Intelligence Tools. No matter the business size, companies are collecting data from multiple sources.

Insiders

Sign Up for our Newsletter

This site is protected by reCAPTCHA and the Google Privacy Policy and Terms of Service apply.

article thumbnail

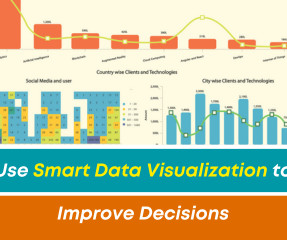
Use Smart Data Visualization to Improve Decisions!

Smarten

Smart Data Visualization and Personalized Dashboards Improve Data Insight and Team Collaboration! Augmented Analytics was designed to remove the barriers erected by the traditional business intelligence and analytics solutions. The use of visual aids shortens meetings by 24%.

article thumbnail

Top 10 Analytics And Business Intelligence Trends For 2020

datapine

Over the past decade, business intelligence has been revolutionized. Spreadsheets finally took a backseat to actionable and insightful data visualizations and interactive business dashboards. 2019 was a particularly major year for the business intelligence industry. Data exploded and became big.

article thumbnail

The Top 20 Data Visualization Books That Should Be On Your Bookshelf

datapine

But often that’s how we present statistics: we just show the notes, we don’t play the music.” – Hans Rosling, Swedish statistician. Data visualization, or ‘data viz’ as it’s commonly known, is the graphic presentation of data. That’s a colossal number of books on visualization. Not sure where to start?

article thumbnail

Dashboard Storytelling: From A Powerful To An Unforgettable Presentation

datapine

In the contemporary world of business, the age-old art of storytelling is far from forgotten: rather than speeches on the Senate floor, businesses rely on striking data visualizations to convey information, drive engagement, and persuade audiences. . Exclusive Bonus Content: Get our free guide for efficient dashboarding!

article thumbnail

Introduction To The Basic Business Intelligence Concepts

datapine

This concept is known as business intelligence. Business intelligence, or “BI” for short, is becoming increasingly prevalent across industries each year. But with business intelligence concepts comes a great deal of confusion, and ultimately – unnecessary industry jargon. Learn here! But more on that later.