Remove Business Intelligence Remove Data-driven Remove Metrics Remove Visualization
article thumbnail

The Ultimate Guide to Modern Data Quality Management (DQM) For An Effective Data Quality Control Driven by The Right Metrics

datapine

1) What Is Data Quality Management? 4) Data Quality Best Practices. 5) How Do You Measure Data Quality? 6) Data Quality Metrics Examples. 7) Data Quality Control: Use Case. 8) The Consequences Of Bad Data Quality. 9) 3 Sources Of Low-Quality Data. 10) Data Quality Solutions: Key Attributes.

article thumbnail

Enhance monitoring and debugging for AWS Glue jobs using new job observability metrics, Part 3: Visualization and trend analysis using Amazon QuickSight

AWS Big Data

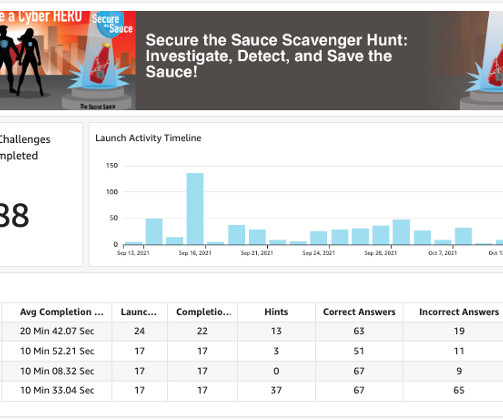
In Part 2 of this series, we discussed how to enable AWS Glue job observability metrics and integrate them with Grafana for real-time monitoring. QuickSight makes it straightforward for business users to visualize data in interactive dashboards and reports.

Metrics 101
Insiders

Sign Up for our Newsletter

This site is protected by reCAPTCHA and the Google Privacy Policy and Terms of Service apply.

Trending Sources

article thumbnail

A Guide To Starting A Career In Business Intelligence & The BI Skills You Need

datapine

4) Business Intelligence Job Roles. Does data excite, inspire, or even amaze you? Do you find computer science and its applications within the business world more than interesting? If you answered yes to any of these questions, you may want to consider a career in business intelligence (BI).In

article thumbnail

Best BI Tools Examples for 2024: Business Intelligence Software

FineReport

Evolving BI Tools in 2024 Significance of Business Intelligence In 2024, the role of business intelligence software tools is more crucial than ever, with businesses increasingly relying on data analysis for informed decision-making.

article thumbnail

Remove Your Rose Tinted Glasses: Data Visualizations Designed to Mislead

datapine

1) Misleading Data Visualization Examples. 2) How to Avoid Misleading Visuals. 3) The Impact Of Bad Data Visualizations. But while that may be the case, people are duped by data visualizations every day. Bad data visualizations come in many forms, with some more obvious than others.

article thumbnail

A Beginner’s Guide To Inventory Metrics And Best Practices

datapine

In our cutthroat digital economy, massive amounts of data are gathered, stored, analyzed, and optimized to deliver the best possible experience to customers and partners. At the same time, inventory metrics are needed to help managers and professionals in reaching established goals, optimizing processes, and increasing business value.

Metrics 286
article thumbnail

The Power Of Real Time Analytics & Business Intelligence Explained

datapine

As digital transformation evolves, and more businesses begin to harness the power of digital technologies, the rate at which we are creating data is rising by the second. As such, we have to find approaches to data analytics and business intelligence. What Is Real Time Business Intelligence?