Remove Dashboards Remove Data Collection Remove Metrics Remove Publishing
article thumbnail

Two Downs Make Two Ups: The Only Success Metrics That Matter For Your Data & Analytics Team

DataKitchen

So it’s Monday, and you lead a data analytics team of perhaps 30 people. But wait, she asks you for your team metrics. Like most leaders of data analytic teams, you have been doing very little to quantify your team’s success. Where is your metrics report? What should be in that report about your data team?

Metrics 130
article thumbnail

Reporting Solutions: A Complete Guide

FineReport

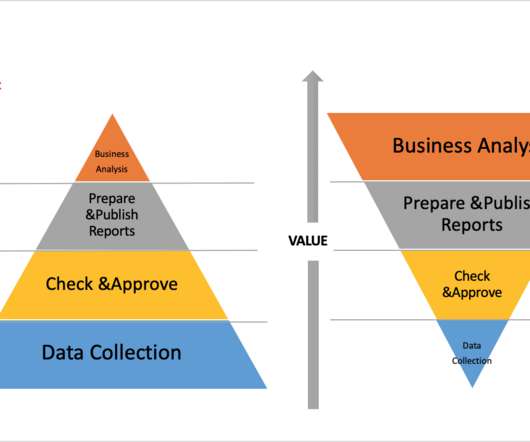
Besides, reporting solutions support managers put together a picture of the relevant data and discover business insides. For most companies, the staffs spend 50% time on data collection, 30% time on checking and approving the data, 15% time on developing and publishing the reports, and 5% on business analysis.

Insiders

Sign Up for our Newsletter

This site is protected by reCAPTCHA and the Google Privacy Policy and Terms of Service apply.

Trending Sources

article thumbnail

Enable advanced search capabilities for Amazon Keyspaces data by integrating with Amazon OpenSearch Service

AWS Big Data

It empowers businesses to explore and gain insights from large volumes of data quickly. Amazon OpenSearch Ingestion is a fully managed, serverless data collection solution that efficiently routes data to your OpenSearch Service domains and Amazon OpenSearch Serverless collections.

article thumbnail

What you need to know about product management for AI

O'Reilly on Data

You might establish a baseline by replicating collaborative filtering models published by teams that built recommenders for MovieLens, Netflix, and Amazon. It may even be faster to launch this new recommender system, because the Disney data team has access to published research describing what worked for other teams.

article thumbnail

Analyst, Scientist, or Specialist? Choosing Your Data Job Title

Sisense

Programming and statistics are two fundamental technical skills for data analysts, as well as data wrangling and data visualization. Overall, however, what often characterizes them is a focus on data collection, manipulation, and analysis, using standard formulas and methods, and acting as gatekeepers of an organization’s data.

article thumbnail

Financial Reporting & Financial Analysis: Definitive Guide

FineReport

However, companies operation generates numerous and complicated data every day, beyond traditional manual reporting capacity. The underlying idea is to find the differences between goals and actual results by comparing corresponding metrics. The listed companies always publish their annual reports. Dupont Analysis Dashboard.

article thumbnail

Optimizing clinical trial site performance: A focus on three AI capabilities

IBM Big Data Hub

2,3 When clinical trials are prematurely discontinued due to trial site underperformance, the research questions remain unanswered and research findings end up not published. It can be integrated into real-time dashboards, visualizations, and reports that provide stakeholders with a comprehensive and up-to-date insight into site performance.