Remove Dashboards Remove Data Integration Remove Forecasting Remove Interactive
article thumbnail

HR Dashboard: Everything You Need To Know

FineReport

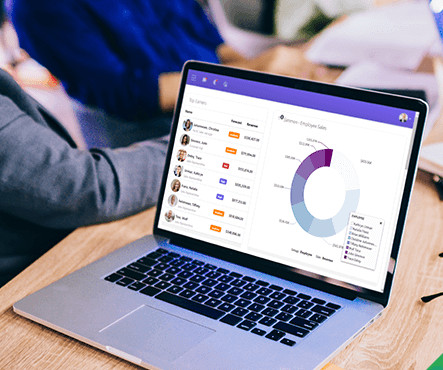
An HR dashboard functions as an advanced analytics tool that utilizes interactive data visualizations to present crucial HR metrics. Similar to various other business departments, human resources is gradually transforming into a data-centric function. What is an HR Dashboard?

article thumbnail

Top Business Intelligence Features To Boost Your Business Performance

datapine

a) Data Connectors Features. c) Dashboard Features. For a few years now, Business Intelligence (BI) has helped companies to collect, analyze, monitor, and present their data in an efficient way to extract actionable insights that will ensure sustainable growth. b) Flexible Data Integration. Table of Contents.

Insiders

Sign Up for our Newsletter

This site is protected by reCAPTCHA and the Google Privacy Policy and Terms of Service apply.

Trending Sources

article thumbnail

Enhance monitoring and debugging for AWS Glue jobs using new job observability metrics, Part 3: Visualization and trend analysis using Amazon QuickSight

AWS Big Data

In Part 2 of this series, we discussed how to enable AWS Glue job observability metrics and integrate them with Grafana for real-time monitoring. Grafana provides powerful customizable dashboards to view pipeline health. QuickSight makes it straightforward for business users to visualize data in interactive dashboards and reports.

Metrics 107
article thumbnail

Three Ways CXO Dashboards Turn Static Data Into Dynamic Insights

Jet Global

With easily customizable dashboards in hand, you’ll be able to intuitively grasp what is happening in your business at a glance, instead of becoming lost in a sea of spreadsheet data. With CXO dashboards, you’ll be able to package and present key data to enable timely decision-making and organizational agility.

article thumbnail

The Role Of Data Warehousing In Your Business Intelligence Architecture

datapine

Each of that component has its own purpose that we will discuss in more detail while concentrating on data warehousing. A solid BI architecture framework consists of: Collection of data. Data integration. Storage of data. Data analysis. Distribution of data. Data integration.

article thumbnail

15 Best Data Analysis Tools You Can’t Miss in 2022

FineReport

The features you or your company need are core factors influencing your selection of the data analytics tool. For example, if you want the features of data visualization , such as stunning dashboards and rich charts, business intelligence tools are more suitable for you than a pure programming tool. 15 Best Data Analysis Tools.

article thumbnail

Master Data Visualization Techniques: A Comprehensive Guide

FineReport

Applications in Various Fields In Business , data visualization is used for sales analysis , market forecasting, and performance KPI tracking. Within the realm of Healthcare , visualized data assists in patient monitoring, disease mapping, and medical research.