Remove Dashboards Remove Data Lake Remove Data Warehouse Remove Interactive
article thumbnail

Top 5 Tools for Building an Interactive Analytics App

Smart Data Collective

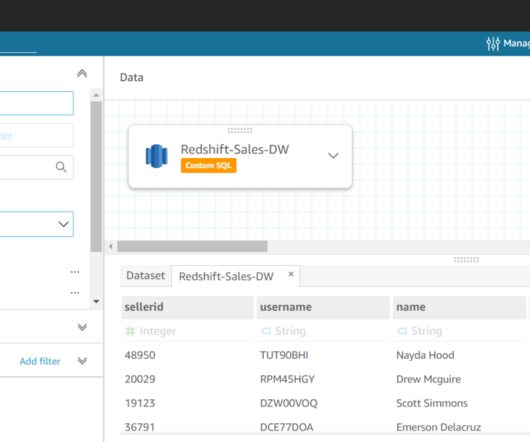
An interactive analytics application gives users the ability to run complex queries across complex data landscapes in real-time: thus, the basis of its appeal. Interactive analytics applications present vast volumes of unstructured data at scale to provide instant insights. Why Use an Interactive Analytics Application?

article thumbnail

Enable business users to analyze large datasets in your data lake with Amazon QuickSight

AWS Big Data

Events and many other security data types are stored in Imperva’s Threat Research Multi-Region data lake. Imperva harnesses data to improve their business outcomes. As part of their solution, they are using Amazon QuickSight to unlock insights from their data.

Insiders

Sign Up for our Newsletter

This site is protected by reCAPTCHA and the Google Privacy Policy and Terms of Service apply.

article thumbnail

How Ruparupa gained updated insights with an Amazon S3 data lake, AWS Glue, Apache Hudi, and Amazon QuickSight

AWS Big Data

In this post, we show how Ruparupa implemented an incrementally updated data lake to get insights into their business using Amazon Simple Storage Service (Amazon S3), AWS Glue , Apache Hudi , and Amazon QuickSight. An AWS Glue ETL job, using the Apache Hudi connector, updates the S3 data lake hourly with incremental data.

article thumbnail

Business Intelligence Dashboard (BI Dashboard): Best Practices and Examples

FineReport

With the advent of Business Intelligence Dashboard (BI Dashboard), access to information is no longer limited to IT departments. Every user can now create interactive reports and utilize data visualization to disseminate knowledge to both internal and external stakeholders.

article thumbnail

Data Lakes: What Are They and Who Needs Them?

Jet Global

The sheer scale of data being captured by the modern enterprise has necessitated a monumental shift in how that data is stored. From the humble database through to data warehouses , data stores have grown both in scale and complexity to keep pace with the businesses they serve, and the data analysis now required to remain competitive.

article thumbnail

Use the Amazon Redshift Data API to interact with Amazon Redshift Serverless

AWS Big Data

Amazon Redshift is a fast, scalable, secure, and fully managed cloud data warehouse that makes it simple and cost-effective to analyze all your data using standard SQL and your existing ETL (extract, transform, and load), business intelligence (BI), and reporting tools. Building a serverless data processing workflow.

article thumbnail

How HR&A uses Amazon Redshift spatial analytics on Amazon Redshift Serverless to measure digital equity in states across the US

AWS Big Data

HR&A has used Amazon Redshift Serverless and CARTO to process survey findings more efficiently and create custom interactive dashboards to facilitate understanding of the results. The following are sample screenshots of the dashboards that show survey responses by zip code.