Remove Dashboards Remove Data mining Remove OLAP Remove Visualization
article thumbnail

What are decision support systems? Sifting data for better business decisions

CIO Business Intelligence

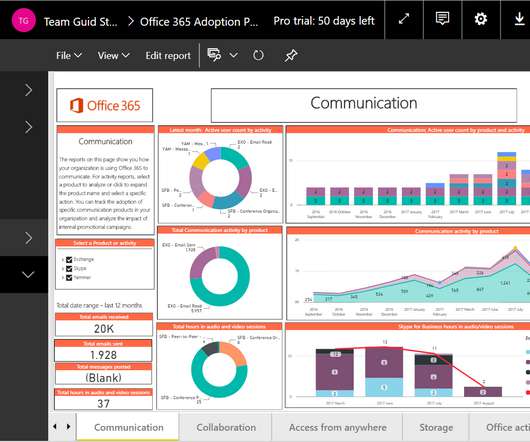
ERP dashboards. Decision support systems are generally recognized as one element of business intelligence systems, along with data warehousing and data mining. Model-driven DSS use data and parameters provided by decision-makers, but Power notes they are usually not data-intensive. Clinical DSS.

article thumbnail

Reporting System: Everything You Need to Know

FineReport

The data analysis part is responsible for extracting data from the data warehouse, using the query, OLAP, data mining to analyze data, and forming the data conclusion with data visualization. You can design, generate, and manage reports in this part.

Insiders

Sign Up for our Newsletter

This site is protected by reCAPTCHA and the Google Privacy Policy and Terms of Service apply.

article thumbnail

A Complete Guide For BI Reporting

FineReport

It is a part of BI features that allow you to extract and dynamically display data in the form of different types of visualizations such as charts and tables, so users can transform data into useful information and discover insights. . In other words, you can view BI reporting as various styles+ dynamic data. .

article thumbnail

Choosing the Reporting Tools: 5 Things You Need To Know

FineReport

Reporting tools are the software help you extract data from the databases, and dynamically display the data in the form of tables, charts, and dashboard. In other words, you can view reporting software as various styles+ dynamic data. . Enterprise Reporting For Visualization . What are the reporting tools?

article thumbnail

The Business Intelligence Market – What’s Old is New

In(tegrate) the Clouds

As the data visualization, big data, Hadoop, Spark and self-service hype gives way to IoT, AI and Machine Learning, I dug up an old parody post on the business intelligence market circa 2007-2009 when cloud analytics was just a disruptive idea. Thanks to The OLAP Report for lots of great market materials.

article thumbnail

Enterprise Reporting: The 2020’s Comprehensive Guide

FineReport

Enterprise reporting is a process of extracting, processing, organizing, analyzing, and displaying data in the companies. It uses enterprise reporting tools to organize data into charts, tables, widgets, or other visualizations. The central one is the data visualization technology at the display level.

article thumbnail

What’s the Difference Between Business Intelligence and Business Analytics?

Sisense

BI lets you apply chosen metrics to potentially huge, unstructured datasets, and covers querying, data mining , online analytical processing ( OLAP ), and reporting as well as business performance monitoring, predictive and prescriptive analytics. See an example: Explore Dashboard. Need a different insight or query?