Remove Dashboards Remove Data Warehouse Remove Metadata Remove Metrics
article thumbnail

Enhance monitoring and debugging for AWS Glue jobs using new job observability metrics, Part 3: Visualization and trend analysis using Amazon QuickSight

AWS Big Data

In Part 2 of this series, we discussed how to enable AWS Glue job observability metrics and integrate them with Grafana for real-time monitoring. Grafana provides powerful customizable dashboards to view pipeline health. QuickSight makes it straightforward for business users to visualize data in interactive dashboards and reports.

Metrics 105
article thumbnail

The Ultimate Guide to Modern Data Quality Management (DQM) For An Effective Data Quality Control Driven by The Right Metrics

datapine

1) What Is Data Quality Management? 4) Data Quality Best Practices. 5) How Do You Measure Data Quality? 6) Data Quality Metrics Examples. 7) Data Quality Control: Use Case. 8) The Consequences Of Bad Data Quality. 9) 3 Sources Of Low-Quality Data. 10) Data Quality Solutions: Key Attributes.

Insiders

Sign Up for our Newsletter

This site is protected by reCAPTCHA and the Google Privacy Policy and Terms of Service apply.

article thumbnail

BMW Cloud Efficiency Analytics powered by Amazon QuickSight and Amazon Athena

AWS Big Data

The CLEA dashboards were built on the foundation of the Well-Architected Lab. For more information on this foundation, refer to A Detailed Overview of the Cost Intelligence Dashboard. Data providers and consumers are the two fundamental users of a CDH dataset.

article thumbnail

Bridging the Gap: How ‘Data in Place’ and ‘Data in Use’ Define Complete Data Observability

DataKitchen

Data in Place refers to the organized structuring and storage of data within a specific storage medium, be it a database, bucket store, files, or other storage platforms. In the contemporary data landscape, data teams commonly utilize data warehouses or lakes to arrange their data into L1, L2, and L3 layers.

Testing 169
article thumbnail

How Automated Metadata Discovery Can Save You Money

Octopai

There are two primary reasons for this: Manual data discovery and manual data lineage. Money Loser #1: Manual Data Discovery. Metadata is at the heart of every report, dashboard, data warehouse, visualization, and anything else the BI team produces. Money Loser #2: Manual Data Lineage.

article thumbnail

Petabyte-scale log analytics with Amazon S3, Amazon OpenSearch Service, and Amazon OpenSearch Ingestion

AWS Big Data

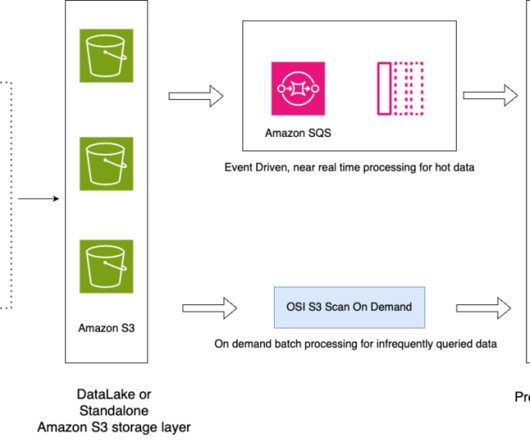
At the same time, they need to optimize operational costs to unlock the value of this data for timely insights and do so with a consistent performance. With this massive data growth, data proliferation across your data stores, data warehouse, and data lakes can become equally challenging.

Data Lake 113
article thumbnail

Near-real-time analytics using Amazon Redshift streaming ingestion with Amazon Kinesis Data Streams and Amazon DynamoDB

AWS Big Data

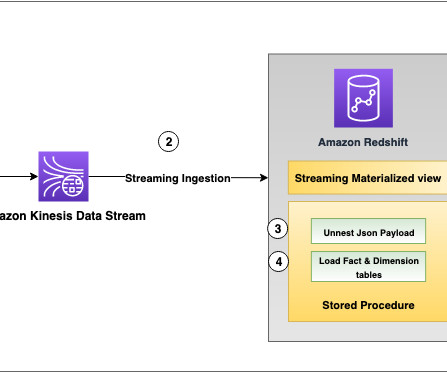
Amazon Redshift is a fully managed, scalable cloud data warehouse that accelerates your time to insights with fast, easy, and secure analytics at scale. Tens of thousands of customers rely on Amazon Redshift to analyze exabytes of data and run complex analytical queries, making it the widely used cloud data warehouse.