Remove Dashboards Remove Data Warehouse Remove Statistics Remove Visualization
article thumbnail

Visualize data quality scores and metrics generated by AWS Glue Data Quality

AWS Big Data

In this post, we highlight the seamless integration of Amazon Athena and Amazon QuickSight , which enables the visualization of operational metrics for AWS Glue Data Quality rule evaluation in an efficient and effective manner. The crawler builds a Data Catalog, so the data can be queried using Athena.

article thumbnail

What are decision support systems? Sifting data for better business decisions

CIO Business Intelligence

A DSS leverages a combination of raw data, documents, personal knowledge, and/or business models to help users make decisions. The data sources used by a DSS could include relational data sources, cubes, data warehouses, electronic health records (EHRs), revenue projections, sales projections, and more.

Insiders

Sign Up for our Newsletter

This site is protected by reCAPTCHA and the Google Privacy Policy and Terms of Service apply.

Trending Sources

article thumbnail

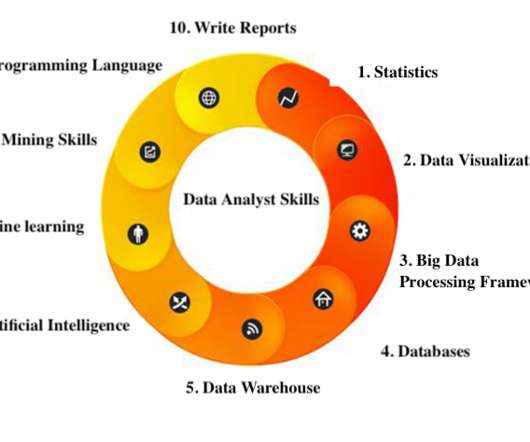
A Guide To Starting A Career In Business Intelligence & The BI Skills You Need

datapine

According to the US Bureau of Labor Statistics, demand for qualified business intelligence analysts and managers is expected to soar to 14% by 2026, with the overall need for data professionals to climb to 28% by the same year. Visualizations are the best tools to make trends and general insights understandable.

article thumbnail

Your Data Won’t Speak Unless You Ask It The Right Data Analysis Questions

datapine

If you want to survive, it’s time to act.” – Capgemini and EMC² in their study Big & Fast Data: The Rise of Insight-Driven Business. If nothing can be changed, there is no point of analyzing data. There are basically 4 types of scales: *Statistics Level Measurement Table*. ETL data warehouse*.

IT 317
article thumbnail

Enhance monitoring and debugging for AWS Glue jobs using new job observability metrics

AWS Big Data

The new metrics provide aggregate and fine-grained insights into the health and operations of your job runs and the data being processed. In addition to providing insightful dashboards, the metrics provide classification of errors, which helps with root cause analysis of performance bottlenecks and error diagnosis.

Metrics 95
article thumbnail

Sisense’s Q2 Release: A Modern Data Experience Across the Analytics Continuum

Sisense

In-Warehouse Data Prep provides builders with the advanced functionality they need to rapidly transform and optimize raw data creating materialized views on cloud data warehouses. In-Warehouse Data Prep supports both AWS Redshift and Snowflake data warehouses. Additional capabilities.

article thumbnail

The top 15 big data and data analytics certifications

CIO Business Intelligence

Candidates are required to complete a minimum of 12 credits, including four required courses: Algorithms for Data Science, Probability and Statistics for Data Science, Machine Learning for Data Science, and Exploratory Data Analysis and Visualization. Candidates have 90 minutes to complete the exam.

Big Data 124