article thumbnail

An Introduction To Data Dashboards: Meaning, Definition & Industry Examples

datapine

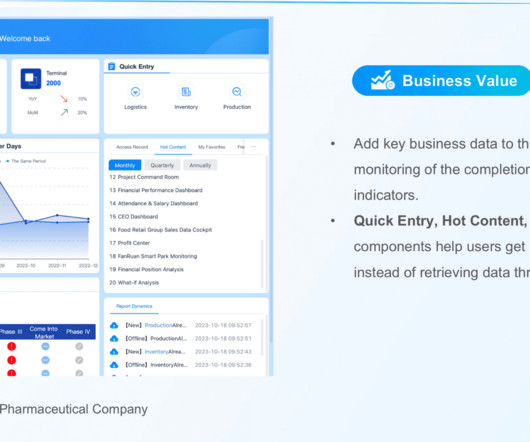
Enter data dashboards – one of history’s best innovations in business intelligence. To help you understand this notion in full, we’re going to explore a data dashboard definition, explain the power of dashboard data, and explore a selection of data dashboard examples. What Is A Data Dashboard? click to enlarge**.

article thumbnail

What is a KPI Report? Definition, Examples, and How-tos

FineReport

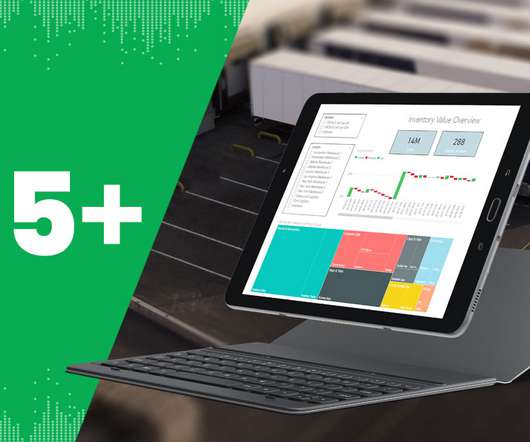
To effectively monitor and analyze these metrics, businesses utilize KPI reports. In this article, we will explore the concept of KPI reports, highlight their significance, provide examples and templates, discuss the essential components, and offer valuable insights on creating KPI reports efficiently.

KPI 52
Insiders

Sign Up for our Newsletter

This site is protected by reCAPTCHA and the Google Privacy Policy and Terms of Service apply.

article thumbnail

Why Dashboard Visualization Matters in the 21st century?

FineReport

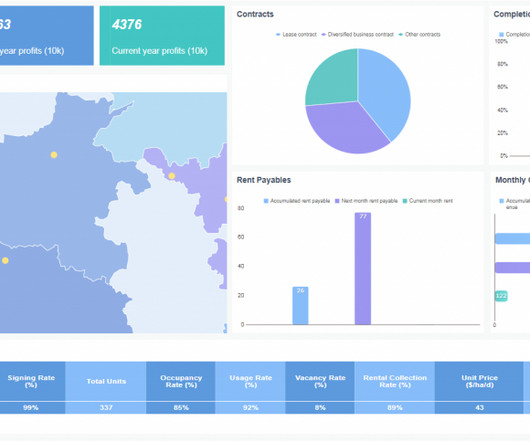
Data dashboard visualization plays a key role in business, whether about analysis or decision. Now, let’s explore the dashboard visualization! What is Dashboard Visualization? Undoubtedly, a reliable data dashboard tool with interactive visualizations renders your clients ready to see how their programs or plans are performing.

article thumbnail

A Data-Driven Guide To Skyrocket Your Year Over Year Growth

datapine

Year over year growth is a KPI that allows you to measure and benchmark your progress against a comparison period of 12 months before. Further, this monthly data can be rolled up into a number chart that summarizes the overall year-over-year growth rate in a financial dashboard. What Is YoY Growth? Why Do You Need YoY Analysis?

article thumbnail

Everything You Need To Know About Static, Dynamic & Real Time Reporting

datapine

While static reporting is a reliable source of information, there is no scope to drill down further into the insights displayed on them, meaning that these informational documents have a short shelf life. A KPI reporting software can even automate and offer the most recent data in all your reports. Financial KPI dashboard.

Reporting 109
article thumbnail

Qlik’s most underrated capabilities

Jet Global

A business user in one region, for instance, could be overwhelmed by KPI data pertaining to their global operations. Allowing users to filter down to their region enables them to analyze their team’s regional KPIs at a glance, and make smarter decisions faster. You can filter out information that’s irrelevant to a particular user.

KPI 52
article thumbnail

Discover The Power Of Modern Performance Reports – See Examples & Best Practices 

datapine

To help you get started with the topic, we put together this insightful guide on modern performance reporting using professional online dashboards. These tools take the reporting process one step further by offering an interactive view of a business’s most important key performance indicators (KPIs) all in one place.

Reporting 207