Remove Dashboards Remove Forecasting Remove Visualization Remove Webinar
article thumbnail

The Art and Science of FP&A Storytelling

Timo Elliott

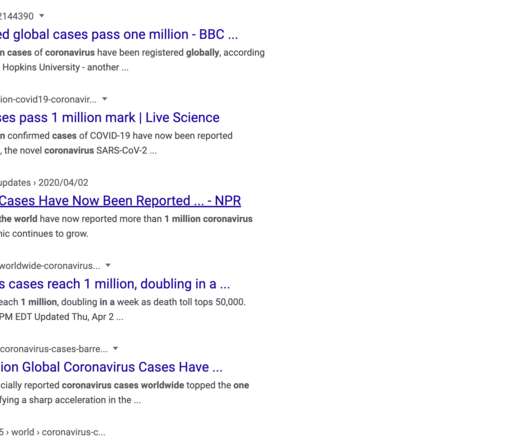
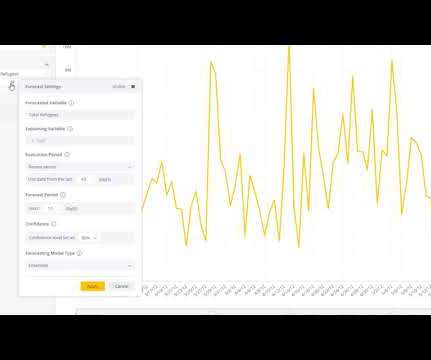
With advanced analytics, flexible dashboarding and effective data visualization, FP&A storytelling has become both an art and science. You can watch the webinar here (registration required) to learn how to conduct FP&A storytelling in order to enhance fact-based decision making. First, because uncertainty exploded.

article thumbnail

The top 15 big data and data analytics certifications

CIO Business Intelligence

Organization: INFORMS Price: US$200 for INFORMS members; US$300 for nonmembers How to prepare: A list of study courses and a series of webinars are available through registration. Candidates show facility with data concepts and environments; data mining; data analysis; data governance, quality, and controls; and visualization.

Big Data 126
Insiders

Sign Up for our Newsletter

This site is protected by reCAPTCHA and the Google Privacy Policy and Terms of Service apply.

article thumbnail

COVID-19 Data Spreads like a Virus

Juice Analytics

Not to minimize the severity of our situation, but the explosion of numbers, charts, dashboards and data stories is beginning to feel like a pandemic of its own. As things have it, the Johns Hopkins University dashboard quickly became the de facto standard, and as a result gets a billion views a day. ONE BILLION!! But it’s not.

article thumbnail

Ultimate List of CFO Blogs and Resources – 2023 Edition

Jet Global

Blogs Podcasts Whitepapers and Guides Tools and Calculators Webinars Sample Reports The Evolution of the CFO into the Chief Data Storyteller View Insight Now Our Favorite CFO Blogs The Venture CFO Blog Link: [link] Are you looking for blog posts for CFOs by CFOs? Check out a sample report from our dynamic dashboard solution.

KPI 105
article thumbnail

7 Questions for Lutz Jannausch, Head of Business Applications, One Commercial Partner Group at Microsoft Germany

Jedox

We spoke with Lutz Jannausch , Head of Business Applications at Microsoft Germany, about developments in business intelligence, data visualization and integrated planning solutions. They provide the tools to easily prepare data and make it accessible at a glance through visualizations even for users who aren’t numbers-nerds.

article thumbnail

Unleash the Power of Advanced Analytics with the Sisense Q4 2019 Release

Sisense

Sisense Forecast is an advanced AI-powered forecasting option that offers unique capabilities to derive new value from data without the need for data science expertise. With a single click, an ensemble of univariate forecast models run against your data. Unleash the power of advanced analytics. Sneak peek: 2020 and beyond.

article thumbnail

How to Increase Sales Productivity and Performance in Your Organization

Jedox

With the help of visually appealing dashboards and reports, evaluating the actuals is simple and straightforward. In sales, the quality and frequency of forecasts can be increased and the effort required for planning, budgeting, and reporting is often reduced. But placing strategic and financial guidance is still a pain.

Sales 59