

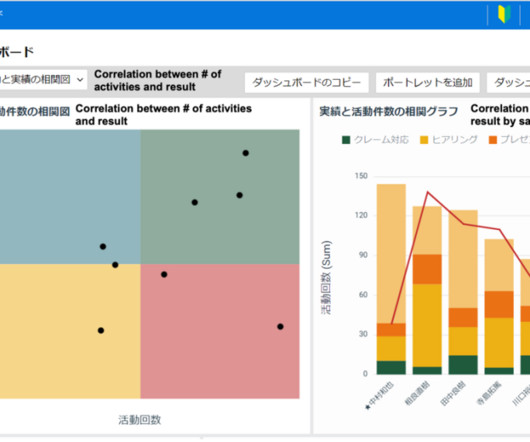
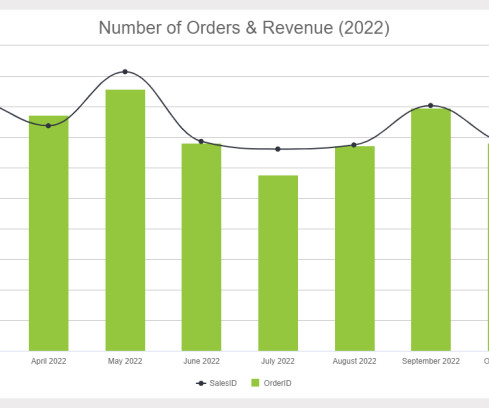
Create an Interactive Sales Dashboard from Scratch on Microsoft Excel
Analytics Vidhya
APRIL 13, 2022
Introduction Microsoft Excel is one of the best tools one can use to analyse data, make stunning charts, plots and dashboards, and basically play with data. The post Create an Interactive Sales Dashboard from Scratch on Microsoft Excel appeared first on Analytics Vidhya. So my dear audience, let us […].


Let's personalize your content