Remove Dashboards Remove Internet of Things Remove Metrics Remove Visualization
article thumbnail

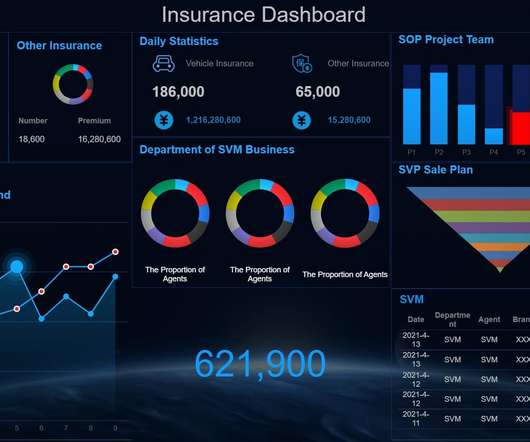
Four popular Java Dashboards for 2021 ——Examples

FineReport

To grasp Java Dashboard, we need to mention Java first. Thus, a Java dashboard is a type of dashboard that is designed with the Java programming language. Thus, a Java dashboard is a type of dashboard that is designed with the Java programming language. Now, I will introduce four Java-based dashboard examples.

article thumbnail

Architectural patterns for real-time analytics using Amazon Kinesis Data Streams, part 1

AWS Big Data

In the subsequent post in our series, we will explore the architectural patterns in building streaming pipelines for real-time BI dashboards, contact center agent, ledger data, personalized real-time recommendation, log analytics, IoT data, Change Data Capture, and real-time marketing data.

Analytics 116
Insiders

Sign Up for our Newsletter

This site is protected by reCAPTCHA and the Google Privacy Policy and Terms of Service apply.

article thumbnail

The Future of AI in the Enterprise

Jet Global

Thankfully, with the widespread adoption of cloud computing and the Internet of Things, data has never been more readily available in today’s business world. With data visualization tools, critical insights are displayed in rich graphical representations that are vastly easier for the human brain to interpret.

article thumbnail

How gaming companies can use Amazon Redshift Serverless to build scalable analytical applications faster and easier

AWS Big Data

It includes business intelligence (BI) users, canned and interactive reports, dashboards, data science workloads, Internet of Things (IoT), web apps, and third-party data consumers. Consumption services Amazon QuickSight is the recommended service for creating reports and dashboards.

article thumbnail

The Future of AI in the Enterprise

Jet Global

Thankfully, with the widespread adoption of cloud computing and the Internet of Things, data has never been more readily available in today’s business world. With data visualization tools, critical insights are displayed in rich graphical representations that are vastly easier for the human brain to interpret.

article thumbnail

Krones real-time production line monitoring with Amazon Managed Service for Apache Flink

AWS Big Data

Managed Service for Apache Flink manages the underlying Apache Flink components that provide durable application state, metrics, logs, and more, and Kinesis enables you to cost-effectively process streaming data at any scale. A rule in this system represents the state of a single metric (such as temperature) or a collection of metrics.

article thumbnail

Accelerate data insights with Elastic and Amazon Kinesis Data Firehose

AWS Big Data

Processing and analyzing log and Internet of Things (IoT) data can be challenging, especially when dealing with large volumes of real-time data. A three-tier web architecture in AWS , which can ingest metrics from several AWS services. You can also customize and save your searches and place them on a dashboard.

IoT 84