Remove Dashboards Remove Measurement Remove Metrics Remove Workshop
article thumbnail

Utilize The Effectiveness Of Professional Executive Dashboards & Reports

datapine

By gaining the ability to gather, organize and analyze the metrics that are most important to your organization, you stand to make your business empire more intelligent than ever before – and executive reporting and business dashboards will help you do just that. Exclusive Bonus Content: Executive Dashboards & Reports: A Summary.

article thumbnail

Business Dashboard: Door To Acute Business Insights

FineReport

Business dashboard: definition & benefits. What is a business dashboard? Business dashboards dig information from data and present an easily digestible view of business performance to help strategic and decision-making. Cartoon sketch of business dashboard. Benefits of business dashboard. Stick to visibility.

Insiders

Sign Up for our Newsletter

This site is protected by reCAPTCHA and the Google Privacy Policy and Terms of Service apply.

article thumbnail

9 Habits of Data Fluent Organizations — and How to Learn Them

Juice Analytics

With our book , resources and workshops, we’ve shared guidance about what it takes to become a data fluent organization. Habit 1: Define shared metrics Data fluency requires getting everyone on the same page as to what matters most. For difficult choices, we have shared baseline: How will it impact our North Star Metric?

Metrics 119
article thumbnail

What Is An Operational Report? A Complete Guide

FineReport

Identifying areas for enhancement : By utilizing operational reports to track key performance indicators (KPIs), businesses can pinpoint areas that are underperforming and take necessary measures to improve them. Operational reports incorporate tools such as dashboards, metrics, and Key Performance Indicators (KPIs).

article thumbnail

Data Quality vs Data Condition: The Power of Context

Anmut

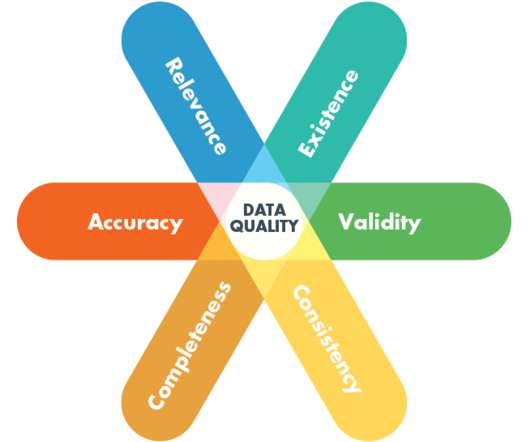
Both measure and compare the current state of your data against the desired state, but the approaches — and the results — are quite different. Data quality assesses your data against standard technical performance measures such as completeness, accuracy, timeliness, validity, and uniqueness. Think about the dashboard in your car.?There

article thumbnail

Q&A: How the Sisense People Team Uses HR Analytics

Sisense

A: We have a set of metrics that we put together and are tracking all the time. Our dashboard is something that I can look into daily and also use to monitor the business on a quarterly basis. Pretty standard measurements to get a high-level view of the entire Sisense organization. We track this through our dashboards.

article thumbnail

Transforming the Future of Learning with Analytics

Sisense

A recent study by Learning Pool revealed 76% of mature metrics practices are enabled by technology that integrates data from multiple sources. Learning Pool’s white paper Measuring the Modern Learner Experience explains how an LRS specifically stores xAPI statements, which at their most basic level combine an actor, a verb, and an object.