Remove Dashboards Remove Metrics Remove Visualization Remove White Paper
article thumbnail

The Pretty Chart Dilemma

Juice Analytics

While clearly placing some value on the user experience with their comment, they clearly miss the point of information design and effective data visualization. Make sure the dashboard uses approved company branded colors." Consider the Juice Dashboard White paper of 10 years ago as a resource to help with language or audience focus.

article thumbnail

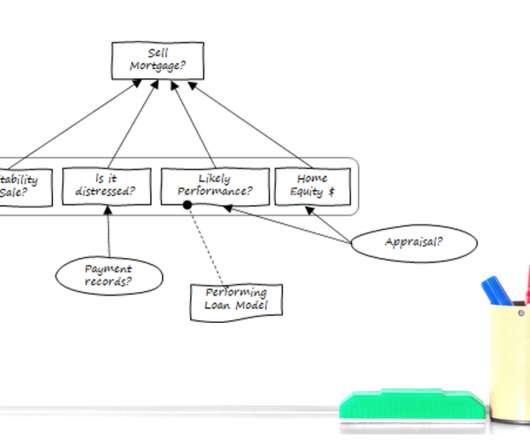
Make Your Investment in Analytic Technology Pay Off With Decision Requirements Modeling

Decision Management Solutions

Like many enterprises, you’ve likely made a hefty investment in analytic technology—from interactive dashboards and advanced visualization tools to data mining, predictive analytics, machine learning (ML), and artificial intelligence (AI). Focusing on decision-making changes everything. We can show you how to accomplish this.

Insiders

Sign Up for our Newsletter

This site is protected by reCAPTCHA and the Google Privacy Policy and Terms of Service apply.

article thumbnail

Transforming the Future of Learning with Analytics

Sisense

A recent study by Learning Pool revealed 76% of mature metrics practices are enabled by technology that integrates data from multiple sources. Learning Pool’s white paper Measuring the Modern Learner Experience explains how an LRS specifically stores xAPI statements, which at their most basic level combine an actor, a verb, and an object.

article thumbnail

The Future of AI in the Enterprise

Jet Global

Chances are good that your average non-technical sales agent or purchasing representative will have difficulty joining multiple tables together with a standard report, but with Business Intelligence cubes, all that is required drag and drop the metrics and dimensions that matter to them into their own personalized dashboard.

article thumbnail

Understanding Data Entities in Microsoft Dynamics 365

Jet Global

Power BI is an analytical tool for data visualization and discovery. For anyone that needs to develop custom reports and dashboards, it all begins with understanding data entities. Microsoft’s Financial Reporting tool (formerly Management Reporter) is primarily for financial statements and general ledger. What Are Data Entities?

article thumbnail

Building the Ultimate Sales Dashboard

Jet Global

This is where sales dashboards have proven to be highly effective. In sales, dashboards play a huge role in managing day-to-day operations, measuring performance, and adapting quickly to changing conditions. To set you up for success in analytics, we have created a quick guide on how to create the ultimate sales dashboard.

Sales 74