article thumbnail

Build Up Your Performance With KPI Scorecards – Examples & Templates

datapine

Tracking the success metrics based on your needs, and the time frame you select while comparing your values can be done with simple yet effective scorecards. What Is A KPI Scorecard? A KPI scorecard is a term used to describe a statistical record that measures progress or achievement towards a set performance indicator.

Scorecard 226
article thumbnail

A Brief History of Data Visualization

Jet Global

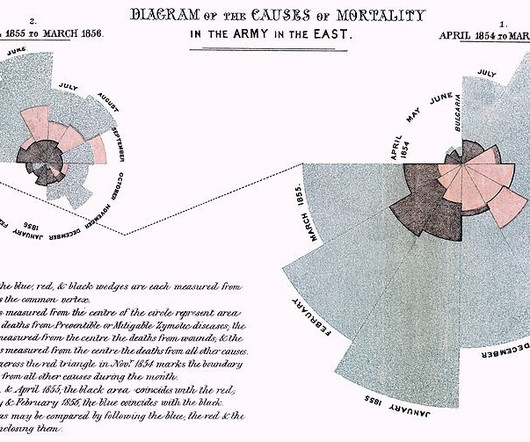
In 1644, Michael Florent Van Langren, a Flemish astronomer, is believed to have provided the first visual representation of statistical data. Many statistical chart types, including histograms, time series plots, contour plots, scatterplots, and others were invented during this period.

Insiders

Sign Up for our Newsletter

This site is protected by reCAPTCHA and the Google Privacy Policy and Terms of Service apply.

Trending Sources

article thumbnail

Visualize data quality scores and metrics generated by AWS Glue Data Quality

AWS Big Data

An operational scorecard is a mechanism used to evaluate and measure the quality of data processed and validated by AWS Glue Data Quality rulesets. We can query and submit the Athena data to QuickSight to create visuals for the dashboard. QuickSight offers a wide range of charts and visuals to help you create your dashboard.

article thumbnail

Fact-based Decision-making

Peter James Thomas

Integrity of statistical estimates based on Data. Having spent 18 years working in various parts of the Insurance industry, statistical estimates being part of the standard set of metrics is pretty familiar to me [7]. The thing with statistical estimates is that they are never a single figure but a range. million ± £0.5

Metrics 49