Remove Data Analytics Remove Key Performance Indicator Remove Measurement Remove Visualization
article thumbnail

13 Essential Data Visualization Techniques, Concepts & Methods To Improve Your Business – Fast

datapine

“By visualizing information, we turn it into a landscape that you can explore with your eyes. 90% of the information transmitted to the brain is visual. Concerning professional growth, development, and evolution, using data-driven insights to formulate actionable strategies and implement valuable initiatives is essential.

article thumbnail

Two Downs Make Two Ups: The Only Success Metrics That Matter For Your Data & Analytics Team

DataKitchen

How to measure your data analytics team? So it’s Monday, and you lead a data analytics team of perhaps 30 people. Like most leaders of data analytic teams, you have been doing very little to quantify your team’s success. What should be in that report about your data team? Introduction.

Metrics 130
Insiders

Sign Up for our Newsletter

This site is protected by reCAPTCHA and the Google Privacy Policy and Terms of Service apply.

Trending Sources

article thumbnail

Top 15 Warehouse KPIs & Metrics For Efficient Management 

datapine

A Warehouse KPI is a measurement that helps warehousing managers to track the performance of their inventory management, order fulfillment, picking and packing, transportation, and overall operations. Therefore, it is very important to pick your indicators based on your actual needs. Let’s dive in with the definition.

Metrics 217
article thumbnail

18 Examples Of Big Data Analytics In Healthcare That Can Save People

datapine

Big data has changed the way we manage, analyze, and leverage data across industries. One of the most notable areas where data analytics is making big changes is healthcare. The application of big data analytics in healthcare has a lot of positive and also life-saving outcomes. 3) Real-Time Alerting.

Big Data 364
article thumbnail

Real-time time series anomaly detection for streaming applications on Amazon Kinesis Data Analytics

AWS Big Data

2022 , with Apache Flink, and provide a working example that will help you get started on a managed Apache Flink solution using Amazon Kinesis Data Analytics. The data points that characterize a time series are recorded in an orderly fashion and are chronological in nature.

article thumbnail

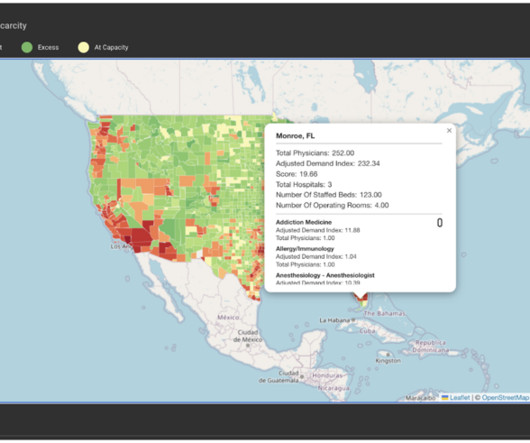
Elevating Healthcare Staffing: From Spreadsheet Chaos to Data-Driven Decisions  

InsightOut

The complexity of handling multiple sets of data, multiple files and tabs in Excel made it increasingly difficult to measure and understand the impact of various key performance indicators (KPIs) on each other and on the business at large. with the ability to drill down into specific regions and specialties.

article thumbnail

An Introduction To Data Dashboards: Meaning, Definition & Industry Examples

datapine

Data dashboards provide a centralized, interactive means of monitoring, measuring, analyzing, and extracting a wealth of business insights from relevant datasets in several key areas while displaying aggregated information in a way that is both intuitive and visual. Data being spread out amongst many databases.