article thumbnail

How Data Integration and Machine Learning Improve Retention Marketing

Business Over Broadway

In this scenario, marketing analytics can only be conducted within one data silo at a time, decreasing your model’s predictive power / increasing your model’s error. Data Integration as your Customer Genome Project. Data Integration as your Customer Genome Project.

article thumbnail

iostudio delivers key metrics to public sector recruiters with Amazon QuickSight

AWS Big Data

Modernized analytics and reporting At iostudio, we faced the challenge of modernizing our government client’s static recruitment marketing analytics solution. Our client had previously been using a data integration tool called Pentaho to get data from different sources into one place, which wasn’t an optimal solution.

Metrics 98
Insiders

Sign Up for our Newsletter

This site is protected by reCAPTCHA and the Google Privacy Policy and Terms of Service apply.

article thumbnail

Mastering BI Dashboard Tools: Your Essential Guide

FineReport

Integration capabilities are key for providing a holistic view and streamlining workflows. Security and Compliance: Data security is paramount. Choose a tool with robust security features to protect data integrity and comply with relevant regulations. Diverse visualization options enable effective communication.

article thumbnail

Master Data Visualization Techniques: A Comprehensive Guide

FineReport

Bar Charts Bar charts are another fundamental visualization method that represents categorical data with rectangular bars of varying lengths. In marketing analytics, bar charts are employed to illustrate sales performance across various product categories, providing a clear visual representation of market trends.

article thumbnail

How The Cloud Made ‘Data-Driven Culture’ Possible | Part 2: Cloud Adoption

BizAcuity

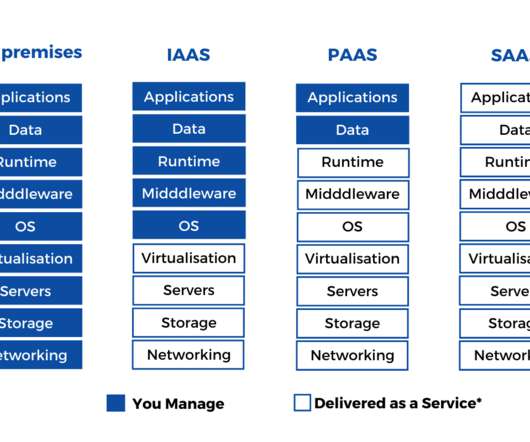
Analytics as a Service (AaaS). A niche within SaaS and one of the last layers specific to what it does even though there are other services like DaaS, MaaS, CaaS and NaaS in the markets. Analytics as a Service is almost a BI tool used for data analysis.and examples are restricted to the industry.

article thumbnail

Ontotext’s Perspective on an Energy Knowledge Graph

Ontotext

That is why we have used GraphDB , Ontotext Platform and our significant expertise in semantic data integration to show how we can improve the quality of ENTSO-E Transparency data and develop flexible analytics by leveraging the knowledge graph approach. Let’s take a closer look.