Remove Data Quality Remove Data Transformation Remove Data Warehouse Remove Visualization
article thumbnail

The Ultimate Guide to Modern Data Quality Management (DQM) For An Effective Data Quality Control Driven by The Right Metrics

datapine

1) What Is Data Quality Management? 4) Data Quality Best Practices. 5) How Do You Measure Data Quality? 6) Data Quality Metrics Examples. 7) Data Quality Control: Use Case. 8) The Consequences Of Bad Data Quality. 9) 3 Sources Of Low-Quality Data.

article thumbnail

Accelerate analytics on Amazon OpenSearch Service with AWS Glue through its native connector

AWS Big Data

As the volume and complexity of analytics workloads continue to grow, customers are looking for more efficient and cost-effective ways to ingest and analyse data. AWS Glue provides both visual and code-based interfaces to make data integration effortless. Choose Create job and Visual ETL. Choose Create connection.

Analytics 100
Insiders

Sign Up for our Newsletter

This site is protected by reCAPTCHA and the Google Privacy Policy and Terms of Service apply.

article thumbnail

­­Use fuzzy string matching to approximate duplicate records in Amazon Redshift

AWS Big Data

Amazon Redshift is a fully managed, petabyte-scale data warehouse service in the cloud. Amazon Redshift enables you to run complex SQL analytics at scale and performance on terabytes to petabytes of structured and unstructured data, and make the insights widely available through popular business intelligence (BI) and analytics tools.

article thumbnail

How Tricentis unlocks insights across the software development lifecycle at speed and scale using Amazon Redshift

AWS Big Data

Every event in the data source can be relevant, and our customers don’t tolerate data loss, poor data quality, or discrepancies between the source and Tricentis Analytics. While aggregating, summarizing, and aligning to a common information model, all transformations must not affect the integrity of data from its source.

article thumbnail

Biggest Trends in Data Visualization Taking Shape in 2022

Smart Data Collective

There are countless examples of big data transforming many different industries. It can be used for something as visual as reducing traffic jams, to personalizing products and services, to improving the experience in multiplayer video games. We would like to talk about data visualization and its role in the big data movement.

article thumbnail

SAP Datasphere Powers Business at the Speed of Data

Rocket-Powered Data Science

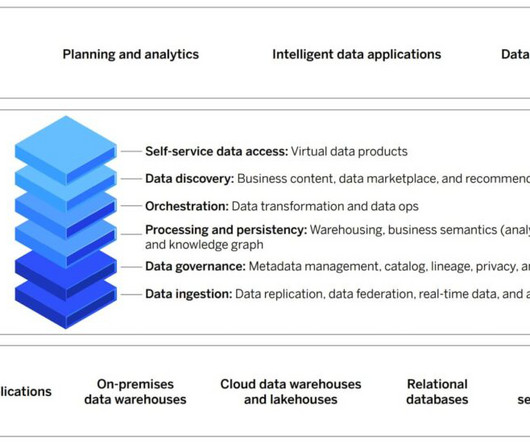
Content includes reports, documents, articles, presentations, visualizations, video, and audio representations of the insights and knowledge that have been extracted from data. This is where SAP Datasphere (the next generation of SAP Data Warehouse Cloud) comes in.

article thumbnail

What is a Data Pipeline?

Jet Global

The key components of a data pipeline are typically: Data Sources : The origin of the data, such as a relational database , data warehouse, data lake , file, API, or other data store. This can include tasks such as data ingestion, cleansing, filtering, aggregation, or standardization.