article thumbnail

What Is An Operational Report? A Complete Guide

FineReport

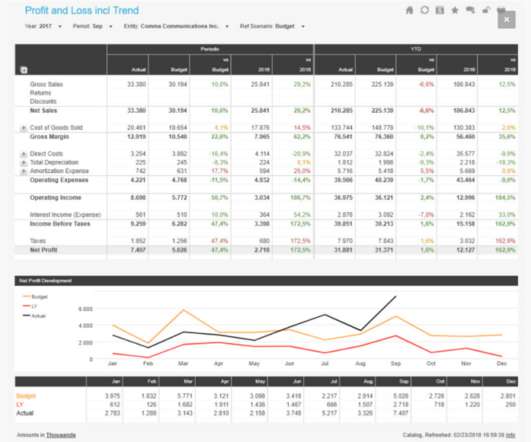
By accessing visually engaging interactive insights, you can enhance your decision-making processes to optimize your operations. The value of these analytical tools stems from their ability to offer an interactive approach to data. Operational reports incorporate tools such as dashboards, metrics, and Key Performance Indicators (KPIs).

article thumbnail

What is a KPI Report? Definition, Examples, and How-tos

FineReport

Key Performance Indicators (KPIs) serve as vital metrics that help measure progress towards business goals. A KPI report, also known as KPI reporting, serves as a management tool for measuring, organizing, and analyzing the primary key performance indicators that are vital to a business.

KPI 52
Insiders

Sign Up for our Newsletter

This site is protected by reCAPTCHA and the Google Privacy Policy and Terms of Service apply.

Trending Sources

article thumbnail

Monitoring Cloudera DataFlow Deployments With Prometheus and Grafana

Cloudera

It allows developers to interactively design data flows in a drag and drop designer, which can be deployed as continuously running, auto-scaling flow deployments or event-driven serverless functions. CDF-PC comes with a monitoring dashboard out of the box for data flow health and performance monitoring.

Metrics 107
article thumbnail

Humans and AI: Should We Describe AI as Autonomous?

DataRobot

In this blog post, I will focus on the use of the word autonomous , the dangers of using it with stakeholders, and, in the context of customer experience, the inaccurate perception that all things can be automated, eliminating the need for interactions between employees and customers. Request a demo. See DataRobot in Action.

article thumbnail

Performance Dashboard: Facilitate The Performance of Your Business

FineReport

Companies can use performance dashboards to guide various indicators, ranging from checking the ability of a department to monitoring the availability of business strategies for global organizations. Performance dashboard is mainly composed of two main entities, key performance indicators (KPI) and dimensions.

article thumbnail

KPI Dashboard: Keys To Achieve Better Performance

FineReport

Have no idea how to select key performance indicators from piles of indicators? KPIs (Key performance indicators) are quantitative indicators used to measure the work performance of staff, being the foundation of an enterprise performance management system. Request Demo.

KPI 52
article thumbnail

Digital Dashboard: Make You Prosper In Digital Era

FineReport

In general, digital dashboard integrates all key performance indicators and data into the dashboard of the same business area, so as to visually display the current status and historical trends of the company, and further assist the company’s decision-making. Request Demo. Definition. Digital dashboard practice.