article thumbnail

Faster data exploration in Jupyter through Lux

Domino Data Lab

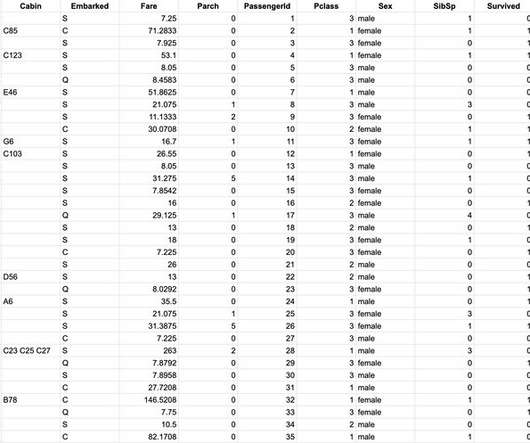
They offer a clear way to collaborate with others throughout the process of data exploration, feature engineering and model fitting and through utilizing some clear best practices , can also become living documents of how that code operates. Saving visualizations in Lux. df = pd.read_csv("/mnt/data/wine_red.csv",sep=';') df.

article thumbnail

Documenting and Managing Governance, Risk and Compliance with Business Process

erwin

Shockingly, a lot of organizations, even today, manage this through, either homemade tools or documents, checklists, Excel files, custom-made databases and so on and so forth. Traditionally, these are manually documented, monitored and managed. Everything needs to be clearly documented, covering all important and relevant aspects.

Risk 98
Insiders

Sign Up for our Newsletter

This site is protected by reCAPTCHA and the Google Privacy Policy and Terms of Service apply.

article thumbnail

5 tips for excelling at self-service analytics

CIO Business Intelligence

Self-service enables all functions, including operations, finance, procurement, supply chain, and continuous improvement teams, to perform data discovery and create powerful visualizations. “We Use embedded analytics Embedded analytics involves the integration of analytical capabilities and data visualizations into business applications.

Analytics 137
article thumbnail

How Model Observability Provides a 360° View of Models in Production

DataRobot Blog

You also need visibility into prediction requests and the ability to slice and dice prediction data over time to have a complete understanding of the internal state of your AI/ML system. Visualize Data Drift Over Time to Maintain Model Integrity. DataRobot MLOps offers user-friendly visuals to track data drift over time.

article thumbnail

In Times of Rapid Change, Business Process Modeling Becomes a Critical Tool

erwin

With the help of business process modeling (BPM) organizations can visualize processes and all the associated information identifying the areas ripe for innovation, improvement or reorganization. You then can understand where your data is, how you can find it, how you can monetize it, how you can report on it, and how you can visualize it.

article thumbnail

Best Reporting Tools List You Can’t Miss in 2020

FineReport

Reporting tools play vital importance in transforming data into visual graphs and charts, presenting data in an attractive and intuitive manner. Wide variety of visualization options such as 3D charts, maps, GIS relationships, dashboards. Price: The product is free, while the help documentation is commercial. .

article thumbnail

Move Beyond Excel, PowerPoint And Static Business Reporting with Powerful Interactive Dashboards

datapine

Visualizing the data and interacting on a single screen is no longer a luxury but a business necessity. They enable you to easily visualize your data, filter on-demand, and slice and dice your data to dig deeper. Maps are important data visualizations and at datapine, we love utilizing them in our dashboards.