Tue.Feb 18, 2020

article thumbnail

11 Powerful Talks from rstudio::conf 2020 you Must Watch – A Treat for R Users!

Analytics Vidhya

Introduction to the rstudio::conf 2020! I’m a heavy R user. It was the first programming language I learned (thanks to my interest in data. The post 11 Powerful Talks from rstudio::conf 2020 you Must Watch – A Treat for R Users! appeared first on Analytics Vidhya.
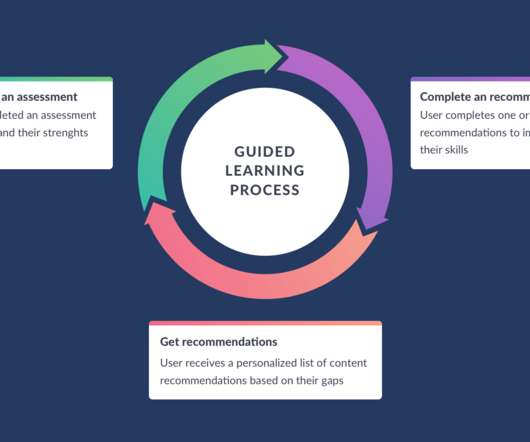
Analytics 390
article thumbnail

Analytics in 2020: Ventana Research Agenda

David Menninger's Analyst Perspectives

Ventana Research recently announced its 2020 research agenda for analytics , continuing the guidance we’ve offered for nearly two decades to help organizations derive optimal value from their technology investments and improve business outcomes. It’s been exciting to follow the emergence of innovative capabilities in the analytics market, but for businesses it can be challenging to stay on top of all these changes.

Analytics 165
Insiders

Sign Up for our Newsletter

This site is protected by reCAPTCHA and the Google Privacy Policy and Terms of Service apply.

article thumbnail

Gartner’s 2020 Magic Quadrant for Data Science and Machine Learning Tools – check out the new Leaders!

Analytics Vidhya

Which Data Science or Machine Learning Tool is the Best? We are living in the age of choices. The data revolution has transformed the. The post Gartner’s 2020 Magic Quadrant for Data Science and Machine Learning Tools – check out the new Leaders! appeared first on Analytics Vidhya.

article thumbnail

Scoring Goals with Data: Champions League Predictions

DataRobot

We at DataRobot have been enjoying building models to predict various sporting events around the world. However, it’s been pointed out to me that we have shown a bias for covering North American events so far. Several colleagues in Europe asked when we were going to predict the world’s most popular game, football. So I enlisted Chloe and Akshay to help me and see if we could predict the Champions League Knockout Stage and the eventual Champions League winner.

Modeling 128
article thumbnail

Get Better Network Graphs & Save Analysts Time

Many organizations today are unlocking the power of their data by using graph databases to feed downstream analytics, enahance visualizations, and more. Yet, when different graph nodes represent the same entity, graphs get messy. Watch this essential video with Senzing CEO Jeff Jonas on how adding entity resolution to a graph database condenses network graphs to improve analytics and save your analysts time.

article thumbnail

Data Management 20/20: The Trinity of the Business Glossary

TDAN

Essential Components forthe Business/IT Lexicographer Today’s organizations often struggle with how poorly their information systems perform. Sources of this poor performance can be many, including functions and components in the conceptual, structural, organizational, and operational domains, among others. One recurring source of this poor performance is linguistic in origin.

article thumbnail

Enfo and Vapo Oy: Partners in environmental change

IBM Big Data Hub

It’s common knowledge that if any business is going to survive, let alone thrive, they must adapt to change. The energy industry in particular has always been at the forefront of evolving its practices for a multitude of reasons. Vapo Oy is one of Finland’s leading energy suppliers, and they are taking a head-on approach to how they deal with change.

IT 95

More Trending

article thumbnail

New Output to Snowflake Capabilities: A Deeper Integration with DataRobot

DataRobot

Deeper integration between DataRobot and Snowflake to help customers go from data to value even faster.

111
111
article thumbnail

Data Outsourcing Strategies Can Skyrocket Your Website Brand

Smart Data Collective

Big data is invaluable for leveraging your brand assets. Your website is a prime example. In 2020, the benefits of big data are more accessible than ever. With a few technical skills and a detailed understanding of big data, it is very easy to start your own business from home with the help of data platforms like KissMetrics or even SAS. For example, it has become very easy to build a large online store with platforms such as WooCommerce and use drop-shipping to sell products without having to s

article thumbnail

Assess Your Team’s Skills in Python, R and SQL With DataCamp Signal

DataCamp

DataCamp Signal™ is an adaptive assessment tool that uses state-of-the-art techniques to give you a bird’s-eye view of your team’s skill level.

91
article thumbnail

3 Types of Map Data Visualization in Python

FineReport

What is map data visualization? Before we start to make map data visualization, we need to know what is it? To be simple, map data visualization is to transform geographic data into a visual form. By visualizing the data with regional characteristics or the results of data analysis on the map, users can more easily understand the laws and trends of data.

article thumbnail

Understanding User Needs and Satisfying Them

Speaker: Scott Sehlhorst

We know we want to create products which our customers find to be valuable. Whether we label it as customer-centric or product-led depends on how long we've been doing product management. There are three challenges we face when doing this. The obvious challenge is figuring out what our users need; the non-obvious challenges are in creating a shared understanding of those needs and in sensing if what we're doing is meeting those needs.

article thumbnail

Q&A Tuesday with Gary Melling: A Look at the Intersection of AI and Data-Driven Business Insights

Jet Global

Gary Melling is the President and CEO of Acquired Insights, a firm that designs customized AI applications and tech-driven strategic initiatives. He’s also a speaker and thought leader widely sought out for his insights into the digital economy. We spoke to Melling about the rise of automation and the imperatives it creates for today’s companies. . We hear about companies becoming “data-driven.

article thumbnail

Cloud-Based Data Mapping Tools

TDAN

Cloud-based analytics is becoming a pivotal tool for today’s digital businesses. Out of its many advantages, the most significant one would be the ability to perform data mapping through cloud-based analytics. Data mapping is an essential process employed in data warehousing to connect separate models to each other. Using a predefined set of methods, the […].

article thumbnail

5 key areas for tech leaders to watch in 2020

O'Reilly on Data

O’Reilly online learning contains information about the trends, topics, and issues tech leaders need to watch and explore. It’s also the data source for our annual usage study, which examines the most-used topics and the top search terms. [1]. This combination of usage and search affords a contextual view that encompasses not only the tools, techniques, and technologies that members are actively using, but also the areas they’re gathering information about.

article thumbnail

DAMA International Community Corner: Update

TDAN

Welcome to DAMA Corner, a source of information for data management professionals here in TDAN.com, the industry leading publication for people interested in learning about data administration and data management disciplines and best practices. Each column provides an update on the professional organization DAMA International, and an opportunity to share your experience with other professionals that are passionate […].

article thumbnail

Beyond the Basics of A/B Tests: Highly Innovative Experimentation Tactics You Need to Know

Speaker: Timothy Chan, PhD., Head of Data Science

Are you ready to move beyond the basics and take a deep dive into the cutting-edge techniques that are reshaping the landscape of experimentation? 🌐 From Sequential Testing to Multi-Armed Bandits, Switchback Experiments to Stratified Sampling, Timothy Chan, Data Science Lead, is here to unravel the mysteries of these powerful methodologies that are revolutionizing how we approach testing.

article thumbnail

15 Examples Of Financial Graphs And Charts You Can Use For Your Business

datapine

The financial health, flow, and fluidity of your business will ultimately dictate its long-term success, which is why monitoring your money matters carefully, comprehensively, and accurately is absolutely essential. In our data-driven digital age, ‘business intelligent’ organizations with the ability to collate, organize, and leverage the insights that are most valuable to their ongoing commercial goals are the ones that are destined to thrive in the long-term.

article thumbnail

Complicated vs Complex Problems

TDAN

Not that long ago our information needs seemed much simpler. If we wanted to make a phone call, we had a relatively simple device to help us do this, the humble rotary dial telephone. Similarly, for other technologies, they were built to do the job specified as simple as possible. What we demand of technology […].

article thumbnail

A Real-Life Excel Test from a Job Interview: Can You Pass??

Depict Data Studio

My heart just about stopped. …. Ten years ago, I was interviewing for an analyst position. The official job title was “Learning and Evaluation Specialist.” Nowadays, you might hear it called “Quality Improvement Specialist,” “Research Analyst,” or even “Data Scientist.”. I remember sitting in the interviewer’s office. He was asking me about my Excel skills.

Testing 118
article thumbnail

Recognizing and Treating “Tableitis”

TDAN

Tableitis (tay-bul-eye’-tus) is a widespread condition suffered by professional data modelers, commonly called “TABLE THINK.” This condition was first recognized by yours truly, Dr. Gordon C. Everest. Treatment rearranges the wheels in your mind so you can see more clearly. Most professional data modelers suffer from Tableitis… are you one of them? The symptoms are […].

article thumbnail

Manufacturing Sustainability Surge: Your Guide to Data-Driven Energy Optimization & Decarbonization

Speaker: Kevin Kai Wong, President of Emergent Energy Solutions

In today's industrial landscape, the pursuit of sustainable energy optimization and decarbonization has become paramount. Manufacturing corporations across the U.S. are facing the urgent need to align with decarbonization goals while enhancing efficiency and productivity. Unfortunately, the lack of comprehensive energy data poses a significant challenge for manufacturing managers striving to meet their targets.