Remove Finance Remove Forecasting Remove KPI Remove Measurement
article thumbnail

KPI Dashboard: Keys To Achieve Better Performance

FineReport

KPI dashboard releases you from your worries and troubles. What is a KPI dashboard? Definition of KPI dashboard. KPIs (Key performance indicators) are quantitative indicators used to measure the work performance of staff, being the foundation of an enterprise performance management system.

KPI 52
article thumbnail

KPI Management And Best Practices: How To Find The Perfect KPI Solutions?

datapine

Table of Contents 1) What Is KPI Management? 2) Why Do KPIs Matter? 3) What Are KPI Best Practices? An even more interesting fact: The blogs we read regularly are not only influenced by KPI management but also concerning content, style, and flow; they’re often molded by the suggestions of these goal-driven metrics.

KPI 221
Insiders

Sign Up for our Newsletter

This site is protected by reCAPTCHA and the Google Privacy Policy and Terms of Service apply.

article thumbnail

30 Best Manufacturing KPIs and Metric Examples for 2021 Reporting

Jet Global

What is an Operations KPI? An Operations Key Performance Indicator (KPI) or metric is a discrete measurement that a company uses to monitor and evaluate the efficiency of its day-to-day operations. These operations KPIs help management identify which operational strategies are effective, and those that inhibit the company.

Metrics 131
article thumbnail

How to Streamline Regulatory Reporting in the Finance and Banking Industry

Jet Global

The volume of regulations and the scale of ongoing regulatory compliance legislation often leave finance teams struggling to meet new reporting requirements. Finance and banking regulatory costs have been forecasted to rise from 4 percent to 10 percent of revenue by 2021. Stop-Gap Measures Are Not Enough.

Finance 52
article thumbnail

An Introduction To Data Dashboards: Meaning, Definition & Industry Examples

datapine

Data dashboards provide a centralized, interactive means of monitoring, measuring, analyzing, and extracting a wealth of business insights from relevant datasets in several key areas while displaying aggregated information in a way that is both intuitive and visual. Prepare to be inspired… 1) Management KPI Dashboard.

article thumbnail

Discover The Power Of Modern Performance Reports – See Examples & Best Practices 

datapine

We are talking about sales, finances, customer service, human resources, and more. This time, including valuable forecasts for costs and income. Each of these KPIs is tracked in its actual value, its forecast value, and the absolute difference in number and percentage. Let’s start with an example from the financial side.

Reporting 207
article thumbnail

6 Steps to Build a Successful BI Strategy Roadmap

FineReport

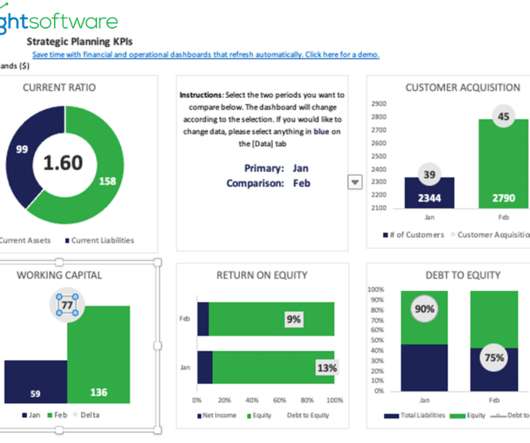
Business intelligence strategy is seen as a roadmap designed to help companies measure their performance and strengthen their performance through architecture and solutions. KPI dashboard for Finance (from FineReport). KPI (Key Performance Indicator)-the indicator you will use to measure performance.