Remove Interactive Remove Metadata Remove Visualization Remove Webinar
article thumbnail

At Center Stage IV: Ontotext Webinars About How GraphDB Levels the Field Between RDF and Property Graphs

Ontotext

This post continues our series in which we want to provide an overview of what we do and how our webinars fit into it. All of our webinars are available on demand, so if we peak your interest with any of these posts, you can request a free recording. Read on and watch the webinars to get convinced. and metaphactory 4.3.

article thumbnail

Automated Metadata Management Tools: Why Some Companies Struggle and Others Flourish During Corona

Octopai

Organizations are turning to the cloud and automated metadata management tools to successfully manage their business’s data. Hear real use cases of BI teams who are leveraging metadata management automation on the cloud while working remotely Check out our webinar "BI During COVID-19." Watch the Webinar.

Insiders

Sign Up for our Newsletter

This site is protected by reCAPTCHA and the Google Privacy Policy and Terms of Service apply.

article thumbnail

Introducing Cloudera DataFlow Designer: Self-service, No-Code Dataflow Design

Cloudera

They value NiFi’s visual, no-code, drag-and-drop UI, the 450+ out-of-the-box processors and connectors, as well as the ability to interactively explore data by starting individual processors in the flow and immediately seeing the impact as data streams through the flow. . Interactivity when needed while saving costs.

Testing 101
article thumbnail

Powerbimap – Announcement and call to register for vendors and consultancies

BI-Survey

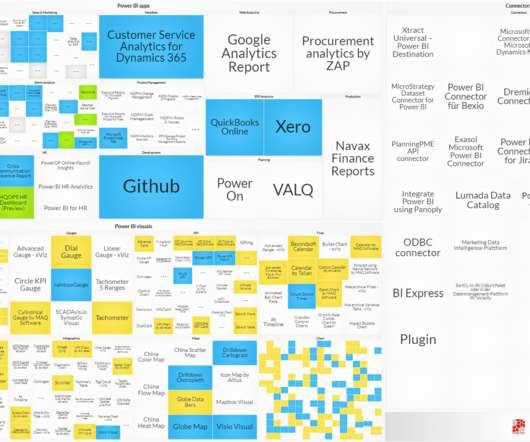
The ecosystem around Microsoft Power BI is growing fast – consultancies and software vendors are adopting the platform to offer added value in visuals, apps, connectors and data management tools. Within the questionnaire, you will find a form to add and promote your webinars and success stories. Your entry is free of charge!

article thumbnail

Alation + Tableau: Fostering Data Culture through Trust and Transparency – Part 1

Alation

They have more time to analyze data, gleaning insights and creating valuable visual assets. Watch the webinar here.). As an example, let’s consider how a typical business user interacts with data without the right technology: She first asks an analyst for it. Metadata (or data about data) is key. The result?

article thumbnail

Powerbimap – Announcement and call to register for vendors and consultancies

BI-Survey

The ecosystem around Microsoft Power BI is growing fast – consultancies and software vendors are adopting the platform to offer added value in visuals, apps, connectors and data management tools. Within the questionnaire, you will find a form to add and promote your webinars and success stories. Your entry is free of charge!

article thumbnail

AzureAnalyticsMap – Information and call to register for vendors and consultancies

BI-Survey

The Azure Analytics browser is an interactive tool offered on the website and includes ALL participants of the Azure Analytics ecosystem. We update the Azure Analytics browser (software, service partners, success story) as well as the webinar database every 2 weeks. Additionally, you can promote your webinars for free.