Remove Key Performance Indicator Remove Metrics Remove Modeling Remove Predictive Analytics
article thumbnail

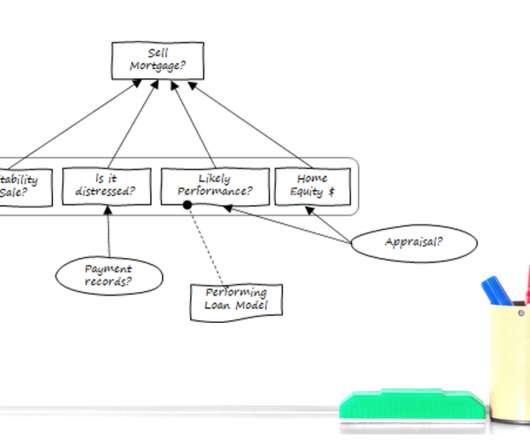
Make Your Investment in Analytic Technology Pay Off With Decision Requirements Modeling

Decision Management Solutions

Like many enterprises, you’ve likely made a hefty investment in analytic technology—from interactive dashboards and advanced visualization tools to data mining, predictive analytics, machine learning (ML), and artificial intelligence (AI). All these elements have a significant role in analytic projects.

article thumbnail

Understanding Augmented Analytics and Its Evolution

Smarten

It also augments the expert and citizen data scientists by automating many aspects of data science, machine learning, and AI model development, management and deployment.’ ‘You What is self-service analytics? Augmented Analytics vs Predictive Analytics is not really a question.

Insiders

Sign Up for our Newsletter

This site is protected by reCAPTCHA and the Google Privacy Policy and Terms of Service apply.

article thumbnail

Smarten Announces SnapShot Anomaly Monitoring Alerts: Powerful Tools for Business Users!

Smarten

Smarten CEO, Kartik Patel says, ‘Smarten SnapShot supports the evolving role of Citizen Data Scientists with interactive tools that allow a business user to gather information, establish metrics and key performance indicators.’

article thumbnail

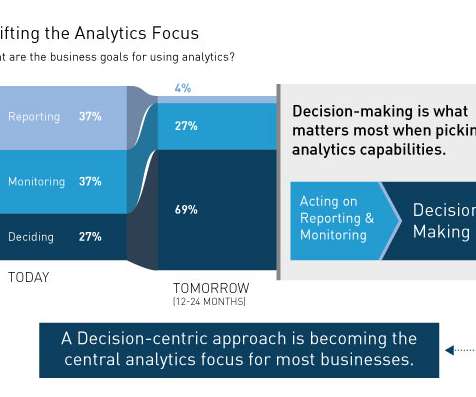
The Purpose of Analytics is not Reporting or Monitoring but Deciding

Decision Management Solutions

The research looked at the increasingly broad portfolio of analytic capabilities available to enterprises – everything from traditional Business Intelligence (BI) capabilities like reporting and ad-hoc queries to modern visualization and data discovery capabilities as well as advanced (predictive) analytics. Monitoring.

Reporting 134
article thumbnail

What is Integrated Business Planning (IBP)?

IBM Big Data Hub

Continuous monitoring and performance management Integrated Business Planning is an ongoing process that requires continuous monitoring of performance against plans and targets. Key performance indicators (KPIs) are established to measure progress and enable proactive management.

article thumbnail

Mastering BI Dashboard Tools: Your Essential Guide

FineReport

Key Features of BI Dashboards: Customizable interface Interactivity Real-time data accessibility Web browser compatibility Predefined templates Collaborative sharing capabilities BI Dashboards vs. BI Reports: While both dashboards and reports are pivotal in business intelligence, they serve distinct purposes.

article thumbnail

Conversational AI use cases for enterprises

IBM Big Data Hub

DL models can improve over time through further training and exposure to more data. When a user sends a message, the system uses NLP to parse and understand the input, often by using DL models to grasp the nuances and intent. Prioritizing tracking metrics accurately measures the success of your implementation.