article thumbnail

Are You Content with Your Organization’s Content Strategy?

Rocket-Powered Data Science

Contextual TAM includes semantic TAM, taxonomic indexing, and even usage-based tags (digital breadcrumbs of the users of specific pieces of content, including the key words and phrases that people used to describe the content in their own reports). Adding these to your organization’s content makes the CMS semantically searchable and usable.

Strategy 266
article thumbnail

Understanding Social And Collaborative Business Intelligence

datapine

Social BI indicates the process of gathering, analyzing, publishing, and sharing data, reports, and information. One of the most imperative features of social BI is its ability to create self-served and user-generated analysis, coupled with the application of business user knowledge. What is Social Business Intelligence?

Insiders

Sign Up for our Newsletter

This site is protected by reCAPTCHA and the Google Privacy Policy and Terms of Service apply.

article thumbnail

On the Hunt for Patterns: from Hippocrates to Supercomputers

Ontotext

These are the so-called supercomputers, led by a smart legion of researchers and practitioners in the fields of data-driven knowledge discovery. Again, the overall aim is to extract knowledge from data and, through algorithms based on artificial intelligence, to assist medical professionals in routine diagnostics processes.

article thumbnail

Business Intelligence System: Definition, Application & Practice

FineReport

It is a process of using knowledge discovery tools to mine previously unknown and potentially useful knowledge. It is an active method of automatic discovery. DASHBOARD REPORTING (by FineReport). The reports and dashboard examples in this article are all built-in templates made by FineReport. REPORT FILLING.

article thumbnail

How Do Super Rookies Start Learning Data Analysis?

FineReport

Data analysis is a type of knowledge discovery that gains insights from data and drives business decisions. Professional data analysts must have a wealth of business knowledge in order to know from the data what has happened and what is about to happen. You can complete real-time report through simple drag and drop operations.

article thumbnail

Bridging the Gap Between Industries: The Power of Knowledge Graphs – Part I

Ontotext

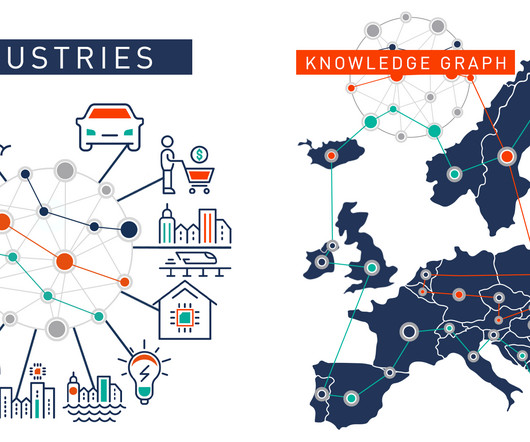
Providing insights into the performance of different systems and processes, knowledge graphs can significantly improve asset management, equipment maintenance, factory floor management & optimization, industrial safety and a lot more. computer manufacturers are relying on knowledge graphs (and GraphDB) in their operations.

article thumbnail

Top Graph Use Cases and Enterprise Applications (with Real World Examples)

Ontotext

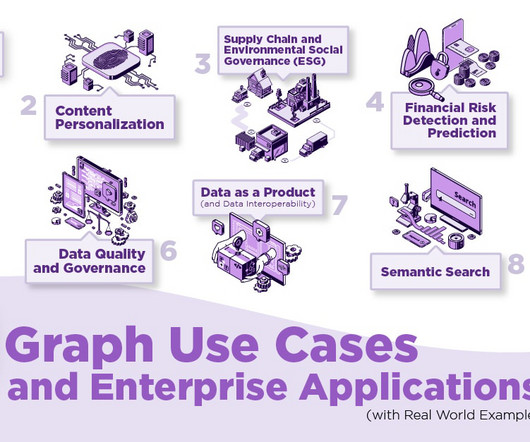
Graphs boost knowledge discovery and efficient data-driven analytics to understand a company’s relationship with customers and personalize marketing, products, and services. Which financial institutions are behind on their risk reporting and filings this year? Linked Data, subscriptions, purchased datasets, etc.).