Remove Measurement Remove Snapshot Remove Statistics Remove Visualization
article thumbnail

Chart Snapshot: Functional Box Plots

The Data Visualisation Catalogue

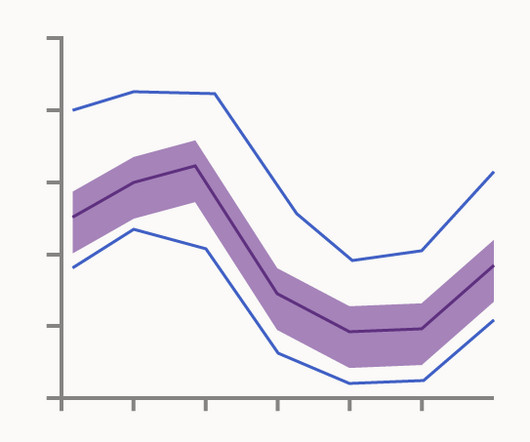
While this visualisation technique is a variation of the classic Box Plot , a Functional Box Plot is visually very different and instead plots a combination of lines and areas to communicate the various data ranges. This region provides a robust measure of the spread of the central 50% of the curves. IQR rule for traditional Box Plots.

article thumbnail

Chart Snapshot: Beanplots

The Data Visualisation Catalogue

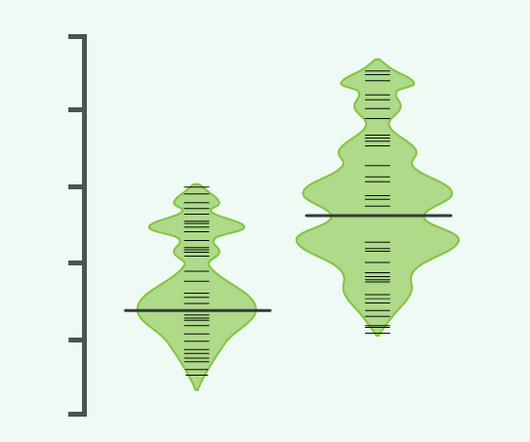
One of the notable features of a Beanplot is its ability to highlight anomalies in the data, such as bimodal distributions or duplicate measurements. Beanplot: A Boxplot Alternative for Visual Comparison of Distributions, Peter Kampstra Figure 4: An asymmetric beanplot of the singers. Long, bold lines correspond to mean of each group.

Insiders

Sign Up for our Newsletter

This site is protected by reCAPTCHA and the Google Privacy Policy and Terms of Service apply.

article thumbnail

Chart Snapshot: Bagplots

The Data Visualisation Catalogue

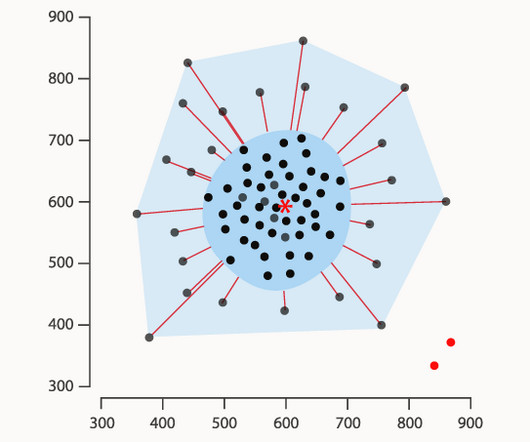
A Bagplot is a visualisation method used in robust statistics primarily designed for analysing two- or three-dimensional datasets. The key purpose of a Bagplot is to provide a comprehensive understanding of various statistical properties of the dataset, including its location, spread, skewness, and identification of outliers.

article thumbnail

Smarten Announces SnapShot Anomaly Monitoring Alerts: Powerful Tools for Business Users!

Smarten

Smarten announces the launch of SnapShot Anomaly Monitoring Alerts for Smarten Augmented Analytics. SnapShot Monitoring provides powerful data analytical features that reveal trends and anomalies and allow the enterprise to map targets and adapt to changing markets with clear, prescribed actions for continuous improvement.

article thumbnail

Your Definitive Guide To Building Valuable Narratives Through Data Storytelling

datapine

Stories inspire, engage, and have the unique ability to transform statistical information into a compelling narrative that can significantly enhance business success. According to a study performed by Skyword, content that features a mix of words and visuals drives 34% more engagement than text-only articles, blog posts, or whitepapers.

KPI 193
article thumbnail

Data Observability and Monitoring with DataOps

DataKitchen

A robust process checks source data and work-in-progress at each processing step along the way to polished visualizations, charts, and graphs. The measurement and monitoring of your end-to-end process can serve as an important tool in the battle to eliminate errors. Week after week, it is measured with a million rows.

Testing 214
article thumbnail

Your Ultimate Guide To Modern KPI Reports In The Digital Age – Examples & Templates

datapine

KPI is a value measured to assess how effective a project or company is at achieving its business objectives. In other words, KPIs provide organizations with the means of measuring how various aspects of the business are performing in relation to their strategic goals. Set up a report which you can visualize with an online dashboard.

KPI 223