article thumbnail

How smava makes loans transparent and affordable using Amazon Redshift Serverless

AWS Big Data

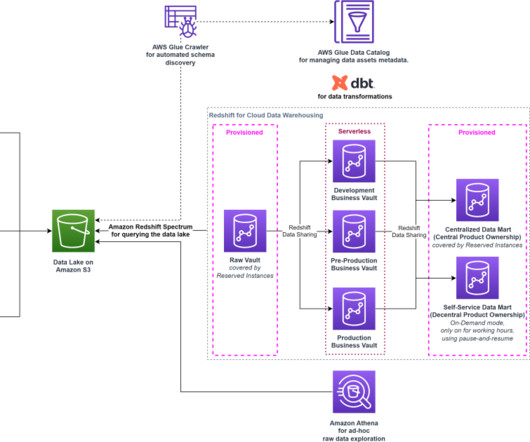
The data products used inside the company include insights from user journeys, operational reports, and marketing campaign results, among others. smava decided to use Tableau for business intelligence, data visualization, and further analytics. The data platform serves on average 60 thousand queries per day.

article thumbnail

Partners in Innovation: Voice of the Customer Enhancements to Logi Symphony

Jet Global

View mode must respect interactivity, responsive layout and limit operations with dashboard. New Dashboard Layout allows “locking” visual position, swap visual position and adaptive layout for mobile devices. Label Positioning allows labels for visuals to be positioned on axis with different orientation.

Insiders

Sign Up for our Newsletter

This site is protected by reCAPTCHA and the Google Privacy Policy and Terms of Service apply.

article thumbnail

What Is Embedded Analytics?

Jet Global

Plus, there is an expectation that tools be visually appealing to boot. In the past, data visualizations were a powerful way to differentiate a software application. Their dashboards were visually stunning. Today, free visualizations seem to be everywhere. It’s all about context. End users expect more from analytics too.

article thumbnail

What is Data Mapping?

Jet Global

Data mapping helps standardize, visualize, and understand data across different systems and applications. ETL tools offer a visual or script-based environment where users can define and customize the transformation processes. Business applications use metadata and semantic rules to ensure seamless data transfer without loss.

article thumbnail

Bridge the Gap Between Reporting and Data Visualization in Power BI

Jet Global

Business intelligence is a key tool, empowering companies to get the most out of their data by providing tools to analyze information, streamline operations, track performance, and inform decision-making. Power BI can generate easy-to-read visualizations that help stakeholders perform key analysis.

article thumbnail

A Stitch in Time: How Jet Analytics Boosts Microsoft Fabric Time-to-Value

Jet Global

End-to-End Data Orchestration With its ability to manage the complete data lifecycle—from collection to transformation and final delivery to visualization and reporting tools—Jet offers extensive orchestration capabilities within Fabric, guaranteeing a smooth workflow throughout the process.