Remove Metrics Remove Modeling Remove Optimization Remove Slice and Dice
article thumbnail

Simplify Metrics on Apache Druid With Rill Data and Cloudera

Cloudera

Cloudera has partnered with Rill Data, an expert in metrics at any scale, as Cloudera’s preferred ISV partner to provide technical expertise and support services for Apache Druid customers. Deploying metrics shouldn’t be so hard. Rill solves this with pipeline services and Rill Developer, a free SQL-based data modeler.

Metrics 85
article thumbnail

How Model Observability Provides a 360° View of Models in Production

DataRobot Blog

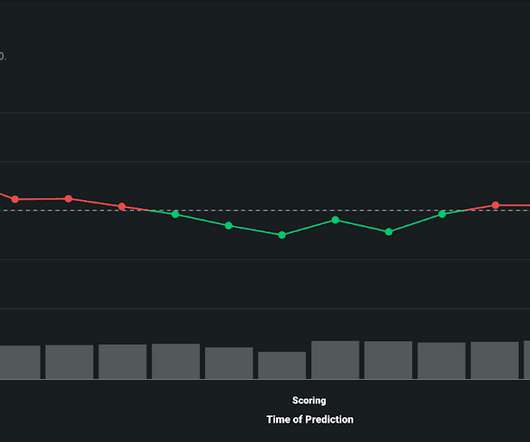
How do you track the integrity of a machine learning model in production? Model Observability can help. By tracking service, drift, prediction data, training data, and custom metrics, you can keep your models and predictions relevant in a fast-changing world. Model Observability Features.

Insiders

Sign Up for our Newsletter

This site is protected by reCAPTCHA and the Google Privacy Policy and Terms of Service apply.

Trending Sources

article thumbnail

13 power tips for Microsoft Power BI

CIO Business Intelligence

With Power BI, you can pull data from almost any data source and create dashboards that track the metrics you care about the most. You can even use large language models (LLMs) to explain features in a Power BI dataset, including easy-to-understand descriptions of complex DAX queries so less experienced users can take advantage of them.

article thumbnail

12 Marketing Reports Examples You Can Use For Annual, Monthly, Weekly And Daily Reporting Practice

datapine

Structure your metrics. As with any report you might need to create, structuring and implementing metrics that will tell an interesting and educational data-story is crucial in our digital age. That way you can choose the best possible metrics for your case. Regularly monitor your data. 1) Marketing CMO report.

Reporting 280
article thumbnail

The Complete Digital Analytics Ecosystem: How To Win Big

Occam's Razor

Digital Analytics Ecosystem: Optimal Execution: Three Phases. Digital Analytics Ecosystem: Optimal Execution: Timing Expectations. At the core of everything you will do in digital analytics is the concept of metrics. How do you define a metric: It is simply a number. Your digital analytics tools are full of metrics.

Analytics 150
article thumbnail

Do I Need Both BI Tools and Augmented Analytics?

Smarten

Recent studies have focused on the trends in business intelligence and augmented analytics, predicting that businesses will grow analytics within the enterprise with: Augmented Analytics to enable non-technical business users to create sophisticated data models. Predictive Modeling to support business needs, forecast, and test theories.

article thumbnail

Data Visualization Inspiration: Analysis To Insights To Action, Faster!

Occam's Razor

Short story #2: Predictive Modeling, Quantifying Cost of Inaction. Short story #4: Multi-dimensional Slicing and Dicing! And sometimes they are indeed optimal: 7 Data Presentation Tips: Think, Simplify, Calibrate, Visualize. You can hover over each box to get a sense of the key metrics. Table comes in.