article thumbnail

Inform Your 2021 By Looking At the Most Popular Finance Content of 2020

Jet Global

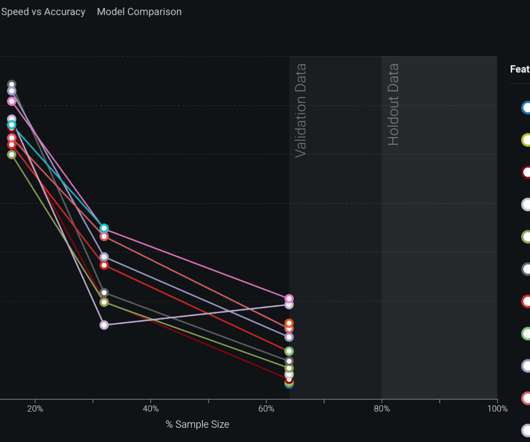
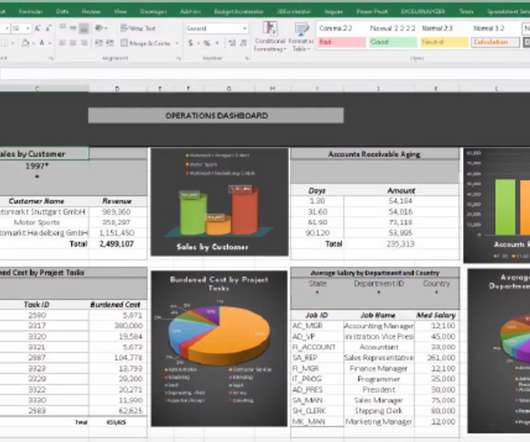
These enable them to have a visual view of what’s going on, for quicker understanding. Our most popular cash flow webinar in 2020 focused on the challenges companies are facing to keep abreast of their cash flow. The Best of 2020: Dashboards and Key Metrics. How to Build a Free Cash Flow Dashboard, with Downloadable Template.

Finance 105
article thumbnail

Using Data to Adapt Your Workforce

Sisense

At this time, it might be tempting to let the HR side of your metrics go. LiveHire and Sisense recently held a webinar on using data to adapt your workforce, and it became abundantly clear data, diversity, and technology will be vital for the workforce of the future. After all, a scattered workforce is hard to manage and track.

Insiders

Sign Up for our Newsletter

This site is protected by reCAPTCHA and the Google Privacy Policy and Terms of Service apply.

article thumbnail

Change The Way You Do ML With Applied ML Prototypes

Cloudera

They need strong data exploration and visualization skills, as well as sufficient data engineering chops to fix the gaps they find in their initial study. The project launches an interactive visualization for exploring the quality of representations extracted using multiple model architectures. Deep Learning for Image Analysis.

article thumbnail

Learn Data Visualization Techniques for Impactful Visual Representations

FineReport

Learn Data Visualization Understanding the Importance of Visualizing Data Data visualization is a powerful tool for conveying complex information in a clear and impactful manner. Whether it’s through charts, graphs, maps, or other visual formats, mastering data visualization is crucial for anyone working with data.

article thumbnail

Product Clustering Techniques in Demand Forecasting

DataRobot

Plotting the historical sales can help visualize the pattern, identify obsolete or zero-inflated items, and create better sub-clustering. Series Insights tells us how each series is performing based on a selected metric (e.g., Building models per product group is a simple and straightforward starting point. Using Series Insights.

article thumbnail

Transforming the Future of Learning with Analytics

Sisense

A recent study by Learning Pool revealed 76% of mature metrics practices are enabled by technology that integrates data from multiple sources. Organizations are now turning to digital innovations such as AI-infused analytics platforms to enhance and grow the knowledge of their teams and talent.

article thumbnail

Knowledge

Occam's Razor

" ~ Web Metrics: "What is a KPI? " + Standard Metrics Revisited Series. "Engagement" Is Not A Metric, It's An Excuse. Defining a "Master Metric", + a Framework to Gain a Competitive Advantage in Web Analytics. Six Data Visualizations That Rock! How do I choose well?

KPI 124