article thumbnail

A Brief History of Data Visualization

Jet Global

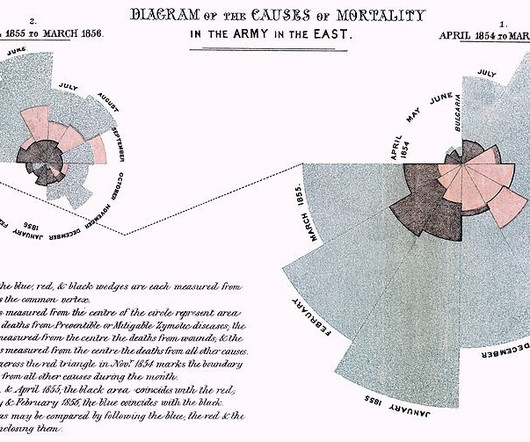
Editors note: This blog was originally published in October 2013, and has been completely revamped and updated for accuracy, relevancy, and comprehensiveness in September 2019 Prior to the 17th century, data visualization existed mainly in the realm of maps, displaying land markers, cities, roads, and resources.

article thumbnail

A Guide To The Top 14 Types Of Reports With Examples Of When To Use Them

datapine

Let’s see it more in detail with a visual example. Progress reports are often used as visual materials to support meetings and discussions. A good example is a KPI scorecard. This insightful report provides a visual overview of every relevant aspect regarding the development of the project.

Reporting 201
Insiders

Sign Up for our Newsletter

This site is protected by reCAPTCHA and the Google Privacy Policy and Terms of Service apply.

article thumbnail

Google Analytics Tutorial: 8 Valuable Tips To Hustle With Data!

Occam's Razor

Produce built-in visualization magic. My preferred path is to leverage the tool's built-in features for filtering/visualizing the data. This option takes the site average for a metric and compares the individual performance of every row to that average, and it visualizes the data for you. I mean really use the tools.

Analytics 145
article thumbnail

The Benefits, Challenges and Risks of Predictive Analytics for Your Application

Jet Global

Your content creators can customize even the tiniest details of the dashboards, data visualizations, interactions, scorecards, labels, and more that they use. Flexibility Logi Symphony uses modern HTML5 and fully open APIs, meaning you can customize and enhance the platform in its entirety.