Remove 2007 Remove Measurement Remove Statistics Remove Uncertainty
article thumbnail

Measuring Validity and Reliability of Human Ratings

The Unofficial Google Data Science Blog

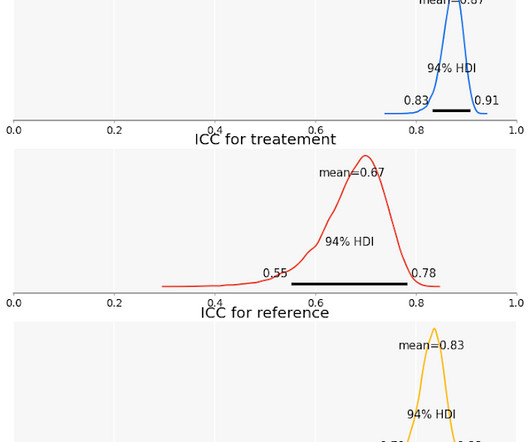
E ven after we account for disagreement, human ratings may not measure exactly what we want to measure. Researchers and practitioners have been using human-labeled data for many years, trying to understand all sorts of abstract concepts that we could not measure otherwise. That’s the focus of this blog post.

article thumbnail

Towards optimal experimentation in online systems

The Unofficial Google Data Science Blog

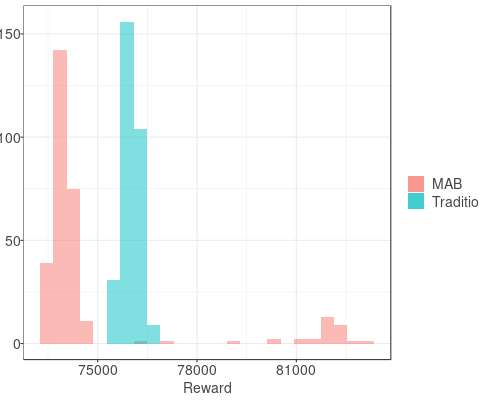
the weight given to Likes in our video recommendation algorithm) while $Y$ is a vector of outcome measures such as different metrics of user experience (e.g., Crucially, it takes into account the uncertainty inherent in our experiments. Figure 2: Spreading measurements out makes estimates of model (slope of line) more accurate.

Insiders

Sign Up for our Newsletter

This site is protected by reCAPTCHA and the Google Privacy Policy and Terms of Service apply.

article thumbnail

The Lean Analytics Cycle: Metrics > Hypothesis > Experiment > Act

Occam's Razor

First, you figure out what you want to improve; then you create an experiment; then you run the experiment; then you measure the results and decide what to do. For each of them, write down the KPI you're measuring, and what that KPI should be for you to consider your efforts a success. Measure and decide what to do.

Metrics 156
article thumbnail

Changing assignment weights with time-based confounders

The Unofficial Google Data Science Blog

For example, imagine a fantasy football site is considering displaying advanced player statistics. A ramp-up strategy may mitigate the risk of upsetting the site’s loyal users who perhaps have strong preferences for the current statistics that are shown. One reason to do ramp-up is to mitigate the risk of never before seen arms.

article thumbnail

The trinity of errors in applying confidence intervals: An exploration using Statsmodels

O'Reilly on Data

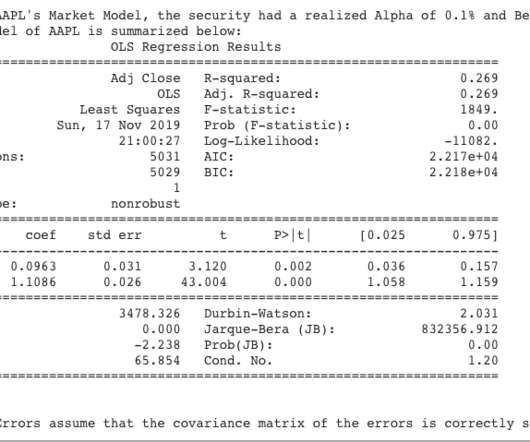
Because of this trifecta of errors, we need dynamic models that quantify the uncertainty inherent in our financial estimates and predictions. Practitioners in all social sciences, especially financial economics, use confidence intervals to quantify the uncertainty in their estimates and predictions.

article thumbnail

Estimating causal effects using geo experiments

The Unofficial Google Data Science Blog

It is important that we can measure the effect of these offline conversions as well. Panel studies make it possible to measure user behavior along with the exposure to ads and other online elements. Let's take a look at larger groups of individuals whose aggregate behavior we can measure. days or weeks).

article thumbnail

Misleading Statistics Examples – Discover The Potential For Misuse of Statistics & Data In The Digital Age

datapine

1) What Is A Misleading Statistic? 2) Are Statistics Reliable? 3) Misleading Statistics Examples In Real Life. 4) How Can Statistics Be Misleading. 5) How To Avoid & Identify The Misuse Of Statistics? If all this is true, what is the problem with statistics? What Is A Misleading Statistic?