article thumbnail

What Are the Most Important Steps to Protect Your Organization’s Data?

Smart Data Collective

Based on figures from Statista , the volume of data breaches increased from 2005 to 2008, then dropped in 2009 and rose again in 2010 until it dropped again in 2011. In 2009 for example, data breaches dropped to 498 million (from 656 million in 2008) but the number of records exposed increased sharply to 222.5 million (from 35.7

Testing 123
article thumbnail

A Retrospective of 2018’s Articles

Peter James Thomas

Overall the total number of articles and new pages I published exceeded 2017’s figures to claim the second spot behind 2009; our first year in business. Statistics & Data Science. How to Spot a Flawed Data Strategy. Statistics & Data Science. How to Spot a Flawed Data Strategy. Data Visualisation.

Insiders

Sign Up for our Newsletter

This site is protected by reCAPTCHA and the Google Privacy Policy and Terms of Service apply.

article thumbnail

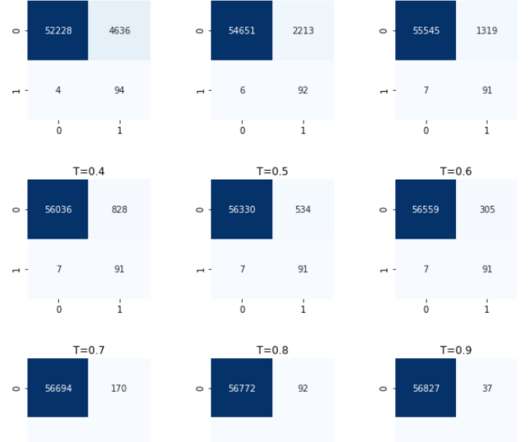
Credit Card Fraud Detection using XGBoost, SMOTE, and threshold moving

Domino Data Lab

In contrast, the decision tree classifies observations based on attribute splits learned from the statistical properties of the training data. Machine Learning-based detection – using statistical learning is another approach that is gaining popularity, mostly because it is less laborious. 3f" % x) dataDF.describe().

article thumbnail

Excellent Analytics Tips #20: Measuring Digital "Brand Strength"

Occam's Razor

eBay's green line is very close the performance of the category (and you'll see that often at peaks in the shopping category queries, eBay actually does worse starting holiday season 2009). The tussle between Wal-Mart and Target is interesting. Amazon is an interesting example.

article thumbnail

PODCAST: COVID19 | Redefining Digital Enterprises – Episode 6: The Impact of COVID-19 on Supply Chain Management

bridgei2i

And over the past few weeks, on our AI to Impact podcast, we’ve been chatting with reputed AI & analytics leaders, digital transformation advisors and BRIDGEi2i business heads to gather their point of view on the current crisis challenges that enterprises are facing and some strategies to manoeuvre the COVID-19 situation.

article thumbnail

Brand Measurement: Analytics & Metrics for Branding Campaigns

Occam's Razor

Ideally you'll measure the number prior to your branding campaign, say Feb 2009, and then you'll measure it again during your campaign, March 2009. It shows which terms (hence brands, sites, properties) have risen the by the most statistically significant amounts. Notice the competitive trends? Sounds dicey!! :)).

article thumbnail

A Picture Paints a Thousand Numbers

Peter James Thomas

Some authorities describe them as any diagram using a map to display statistical data; I cover this type of general chart in Map Charts below. The inimitable Randall Munroe of xkcd.com [7] explains this pithility as follows: | © Randall Munroe, xkcd.com (2009) | Excerpted from: Extrapolating |. Cartograms.

Sales 61