article thumbnail

Generative AI: A paradigm shift in enterprise and startup opportunities

CIO Business Intelligence

Deep learning emerged in academia in the early 2000s, with broader industry adoption starting around 2010. Software and product development : Generative AI will simplify the entire development cycle from code generation, code completion, bug detection, documentation, and testing.

article thumbnail

Structural Evolutions in Data

O'Reilly on Data

” There’s as much Keras, TensorFlow, and Torch today as there was Hadoop back in 2010-2012. You can see a simulation as a temporary, synthetic environment in which to test an idea. Millions of tests, across as many parameters as will fit on the hardware. Those algorithms packaged with scikit-learn?

Insiders

Sign Up for our Newsletter

This site is protected by reCAPTCHA and the Google Privacy Policy and Terms of Service apply.

Trending Sources

article thumbnail

Benchmark Results Position GraphDB As the Most Versatile Graph Database Engine

Ontotext

RDF engines are good for graph analytics Historically, the Labeled Property Graph (LPG) engines were optimized to deal with graph analytics, while the Resource Description Framework (RDF) engines were designed for data publishing and metadata management. GraphDB was audited to perform 12 operations/second on an AWS r6id.8xlarge

article thumbnail

Euro Soccer Special: What Football Teaches Us About Analytics

Sisense

It’s no surprise that rivals followed suit and that by 2010 analytics were widely used by top teams in leading international leagues. In training, wearable devices measure players’ workload, movement, and fatigue levels to manage their fitness and positioning and optimize their performance during play.

article thumbnail

Changing assignment weights with time-based confounders

The Unofficial Google Data Science Blog

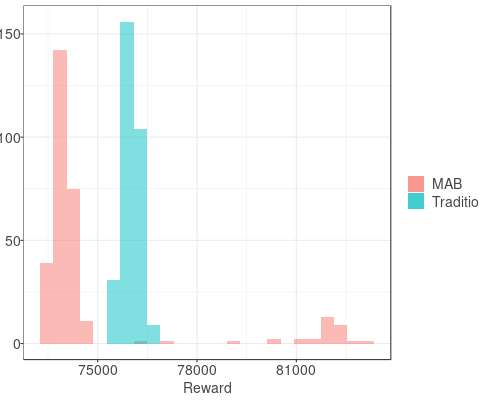
Another reason to use ramp-up is to test if a website's infrastructure can handle deploying a new arm to all of its users. The website wants to make sure they have the infrastructure to handle the feature while testing if engagement increases enough to justify the infrastructure. We offer two examples where this may be the case.

article thumbnail

Real-Real-World Programming with ChatGPT

O'Reilly on Data

To provide some coherence to the music, I decided to use Taylor Swift songs since her discography covers the time span of most papers that I typically read: Her main albums were released in 2006, 2008, 2010, 2012, 2014, 2017, 2019, 2020, and 2022. This choice also inspired me to call my project Swift Papers.

article thumbnail

Magnificent Mobile Website And App Analytics: Reports, Metrics, How-to!

Occam's Razor

In blue is how much time we spent in 2010 and in blue the time spent in 2014. was the dramatic shift between 2010 to 2014 to mobile content consumption. If you want to go it alone, get a Red Bull and download this handy-dandy 62 slide Cross Devices Optimization presentation. What was surprising, even to me (!), Many reasons.

Metrics 141