Remove 2012 Remove Optimization Remove Statistics Remove Testing
article thumbnail

Towards optimal experimentation in online systems

The Unofficial Google Data Science Blog

If $Y$ at that point is (statistically and practically) significantly better than our current operating point, and that point is deemed acceptable, we update the system parameters to this better value. In isolation, the $x_1$-system is optimal: changing $x_1$ and leaving the $x_2$ at 0 will decrease system performance.

article thumbnail

Measure performance of AWS Glue Data Quality for ETL pipelines

AWS Big Data

AWS Glue Data Quality reduces the effort required to validate data from days to hours, and provides computing recommendations, statistics, and insights about the resources required to run data validation. In this post, we provide benchmark results of running increasingly complex data quality rulesets over a predefined test dataset.

Insiders

Sign Up for our Newsletter

This site is protected by reCAPTCHA and the Google Privacy Policy and Terms of Service apply.

article thumbnail

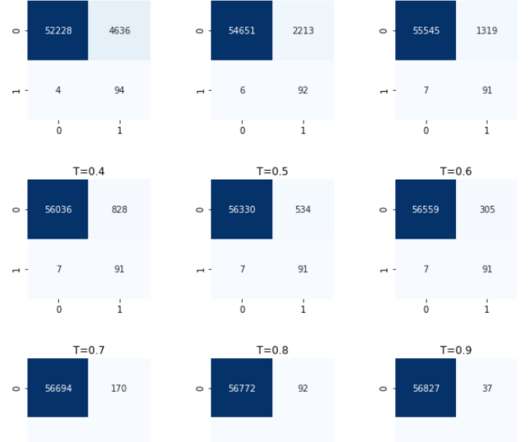
Credit Card Fraud Detection using XGBoost, SMOTE, and threshold moving

Domino Data Lab

In contrast, the decision tree classifies observations based on attribute splits learned from the statistical properties of the training data. Machine Learning-based detection – using statistical learning is another approach that is gaining popularity, mostly because it is less laborious. 3f" % x) dataDF.describe().

article thumbnail

Unintentional data

The Unofficial Google Data Science Blog

1]" Statistics, as a discipline, was largely developed in a small data world. Yet when we use these tools to explore data and look for anomalies or interesting features, we are implicitly formulating and testing hypotheses after we have observed the outcomes. We must correct for multiple hypothesis tests.

article thumbnail

To Balance or Not to Balance?

The Unofficial Google Data Science Blog

A naïve way to solve this problem would be to compare the proportion of buyers between the exposed and unexposed groups, using a simple test for equality of means. Identification We now discuss formally the statistical problem of causal inference. We start by describing the problem using standard statistical notation.

article thumbnail

Time Series with R

Domino Data Lab

A big part of statistics, particularly for financial and econometric data, is analyzing time series, data that are autocorrelated over time. Fortunately, the forecast package has a number of functions to make working with time series data easier, including determining the optimal number of diffs. The result is shown in Figure 24.4. >

article thumbnail

Using random effects models in prediction problems

The Unofficial Google Data Science Blog

We often use statistical models to summarize the variation in our data, and random effects models are well suited for this — they are a form of ANOVA after all. both L1 and L2 penalties; see [8]) which were tuned for test set accuracy (log likelihood). bandit problems).