Remove 2017 Remove Optimization Remove Statistics Remove Visualization
article thumbnail

Towards optimal experimentation in online systems

The Unofficial Google Data Science Blog

If $Y$ at that point is (statistically and practically) significantly better than our current operating point, and that point is deemed acceptable, we update the system parameters to this better value. In isolation, the $x_1$-system is optimal: changing $x_1$ and leaving the $x_2$ at 0 will decrease system performance.

article thumbnail

Create High-Impact Data Visualizations: Nine Effective Strategies

Occam's Razor

In service of that belief, there are few things that bring me as much joy as visualizing data (smart segmentation comes close). While I am partial to the simplest of visualizations in a business data context, I love a simple Bar Chart just as much as a Chord or Fisher-Yates Shuffle. 6: Turbocharging Data Visuals with Storytelling.

Insiders

Sign Up for our Newsletter

This site is protected by reCAPTCHA and the Google Privacy Policy and Terms of Service apply.

Trending Sources

article thumbnail

Themes and Conferences per Pacoid, Episode 9

Domino Data Lab

Finale Doshi-Velez, Been Kim (2017-02-28) ; see also the Domino blog article about TCAV. Adrian Weller (2017-07-29). “ On the other hand, as Lipton emphasized, while the tooling produces interesting visualizations, visualizations do not imply interpretation. ML model interpretability and data visualization.

article thumbnail

What is SSDP and Can it Truly Make Analytics Self-Serve?

Smarten

SSDP allows average business users to compile and prepare data and use that data in analytics to test hypotheses, visualize and share data, prepare reports and support day-to-day tasks with complete drill-down and drill-through capability, custom alerts and mobile access that supports the needs of every team member.

article thumbnail

5 key areas for tech leaders to watch in 2020

O'Reilly on Data

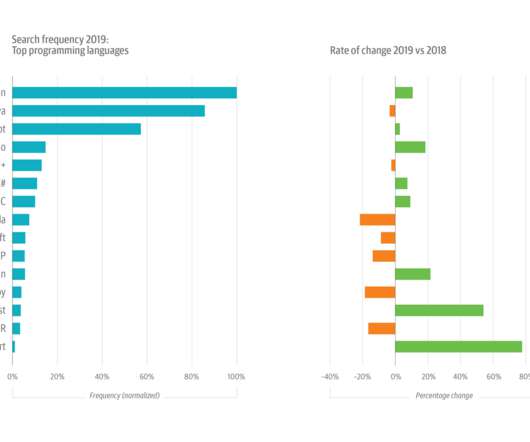
Up until 2017, the ML+AI topic had been amongst the fastest growing topics on the platform. After several years of steady climbing—and after outstripping Java in 2017—Python-related interactions now comprise almost 10% of all usage. Not necessarily: Java-related searches increased by 5% between 2017 and 2018. Coincidence?

article thumbnail

Fitting Bayesian structural time series with the bsts R package

The Unofficial Google Data Science Blog

SCOTT Time series data are everywhere, but time series modeling is a fairly specialized area within statistics and data science. They may contain parameters in the statistical sense, but often they simply contain strategically placed 0's and 1's indicating which bits of $alpha_t$ are relevant for a particular computation. by STEVEN L.

article thumbnail

Adding Common Sense to Machine Learning with TensorFlow Lattice

The Unofficial Google Data Science Blog

On the one hand, basic statistical models (e.g. The first is that they are straightforward to optimize using traditional gradient-based optimizers as long as we pre-specify the placement of the knots. There is a robust set of tools for working with these kinds of constrained optimization problems. Pfeifer, J.