article thumbnail

Build Up Your Performance With KPI Scorecards – Examples & Templates

datapine

Tracking the success metrics based on your needs, and the time frame you select while comparing your values can be done with simple yet effective scorecards. What Is A KPI Scorecard? A KPI scorecard is a term used to describe a statistical record that measures progress or achievement towards a set performance indicator.

Scorecard 226
article thumbnail

A Complete Guide To Bar Charts With Examples, Benefits, And Different Types 

datapine

In that regard, using a professional KPI dashboard is a great way to provide context and tell a complete data story. Marketing The first one in our list of bar graphs examples is a critical paid marketing KPI, the cost per click or CPC tracks the amount of money a business spends every time a person clicks on an ad.

Insiders

Sign Up for our Newsletter

This site is protected by reCAPTCHA and the Google Privacy Policy and Terms of Service apply.

Trending Sources

article thumbnail

How to Calculate Year-Over-Year Growth

Sisense

Case in point: when you look at your company’s monthly metrics, you’re focused solely on a single month’s worth of data. Unlike standalone monthly metrics, YOY gives you a picture of your performance without seasonal effects, monthly volatility, and other factors. Unsurprisingly, this is a key metric for retail analytics.

KPI 96
article thumbnail

Create Modern SQL Dashboards With Professional Tools & Software

datapine

A SQL dashboard is a visual representation of data and metrics that are generated from a SQL relational database, and processed through a dashboard software in order to perform advanced analysis by creating own queries, or using a visual drag-and-drop interface. But let’s start from the beginning and define this kind of a dashboard.

article thumbnail

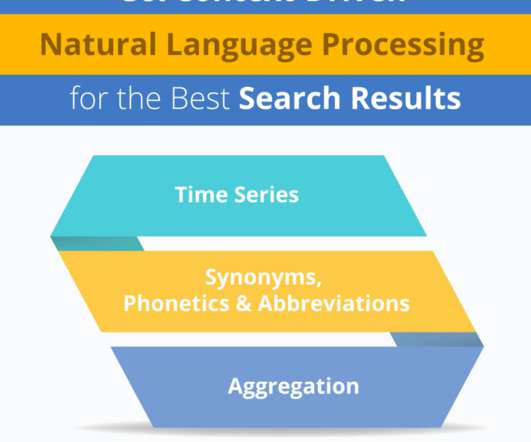
Get Context-Driven Natural Language Processing for the Best Search Results!

Smarten

When a business sets goals and establishes metrics to determine the value of an analytical solution and a business user analytics initiative within the enterprise, the management team often fails to focus on the more subtle, but powerful, concept of efficacy. Who sold the most fruit juice in Phonix, Arizona in Christmas of 2018?

article thumbnail

What AI Means to a Data Scientist

Birst BI

Source: Gartner (April 2018). Use Birst Pronto to implement the model by creating an R transform step that creates a new metric. This new metric can then be networked into the governed semantic layer. Any business user or analyst can report on this new metric through a report or dashboard.

article thumbnail

The Importance Of Financial Reporting And Analysis: Your Essential Guide

datapine

Utilizing financial data with the help of online data analysis tools allows you to not only share vital information both internally and externally but also leverage metrics or insights to make significant improvements to the very area that allows your business to flow. Download right here your bite-sized summary of the finance world!

Reporting 248