Remove 2019 Remove Dashboards Remove Statistics Remove Visualization
article thumbnail

A Brief History of Data Visualization

Jet Global

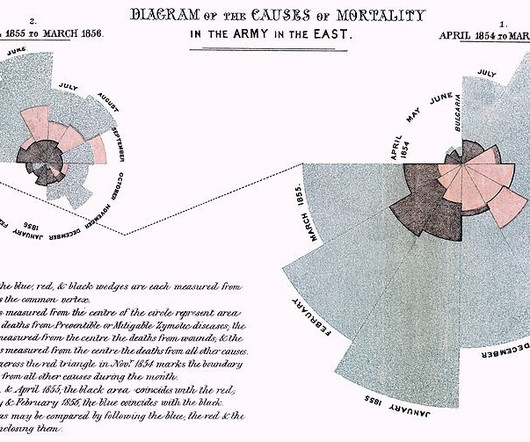
Editors note: This blog was originally published in October 2013, and has been completely revamped and updated for accuracy, relevancy, and comprehensiveness in September 2019 Prior to the 17th century, data visualization existed mainly in the realm of maps, displaying land markers, cities, roads, and resources.

article thumbnail

What is business analytics? Using data to improve business outcomes

CIO Business Intelligence

Business analytics is the practical application of statistical analysis and technologies on business data to identify and anticipate trends and predict business outcomes. Business analytics also involves data mining, statistical analysis, predictive modeling, and the like, but is focused on driving better business decisions.

Insiders

Sign Up for our Newsletter

This site is protected by reCAPTCHA and the Google Privacy Policy and Terms of Service apply.

article thumbnail

Top 6 Data Analytics Tools in 2019

FineReport

First, data processing, data cleaning, and then data modeling, finally data visualization that uses presentation of charts to identify problems and influence decision-making. From the perspective of development history and current market feedback, Tableau is better at visualization. 1) Professional statistical analysis.

article thumbnail

Sisense’s Q2 Release: A Modern Data Experience Across the Analytics Continuum

Sisense

Another feature of In-Warehouse Data Prep is the warehouse statistics profiling view, which allows users to understand their data at a glance, identifying patterns, relationships, and unexpected values. Self-service dashboards: Your insights, your way. Her debut novel, The Book of Jeremiah , was published in 2019.

article thumbnail

Creating a Powerful Presentation: 3 Easy Changes to Revamp your PowerPoint

Depict Data Studio

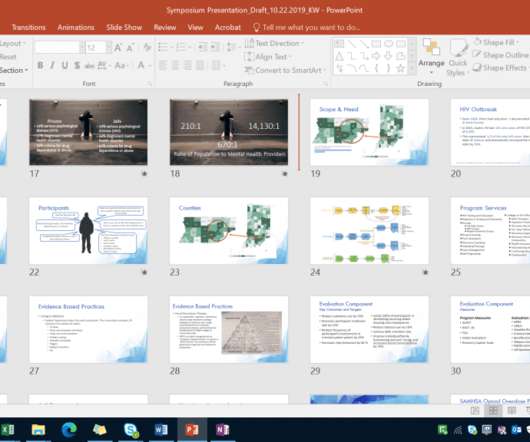
I first came across Ann’s work when our company signed a few of us up for a dashboard webinar. Let’s look at a presentation I did at the Indiana 10th Annual Drug Symposium in 2019 over an offender reentry grant I was evaluating. There just was so little to keep it visually interesting. Look at all of that text! Readability.

article thumbnail

How Do Super Rookies Start Learning Data Analysis?

FineReport

Taking FineReport as an example, it is a BI reporting tool that can connect to various data sources, quickly analyze the data, and make various reports and cool dashboards. At the same time, it also advocates visual exploratory analysis. The visualization component library of FineReport is very rich. Dashboard of FineReport.

article thumbnail

Join me at Live! 360 Orlando to learn more about Applied Business Analytics

Jen Stirrup

The conference is held on November 17-22, 2019 at the Royal Pacific Resort at Universal Orlando in Florida. Essential Business Statistics for Analytics Success – the important statistics that business users use often in business spheres, such as marketing and strategy. The average attention span is only eight seconds.