Remove 2020 Remove Analytics Remove Dashboards Remove KPI
article thumbnail

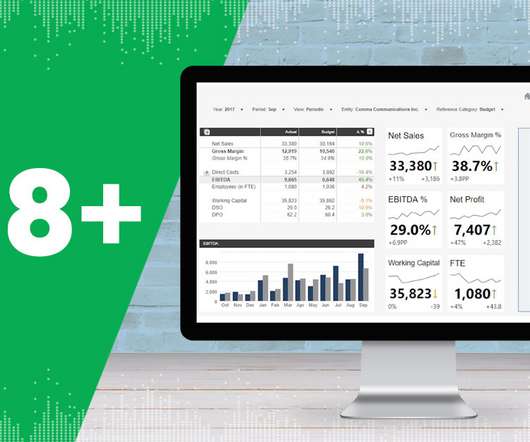
An Introduction To Data Dashboards: Meaning, Definition & Industry Examples

datapine

According to the EMC Digital Universe study, by 2020, around 40 trillion megabytes – or 40 zettabytes – will exist in our digital landscape. Enter data dashboards – one of history’s best innovations in business intelligence. Let’s kick things off by asking the question: what is a data dashboard? What Is A Data Dashboard?

article thumbnail

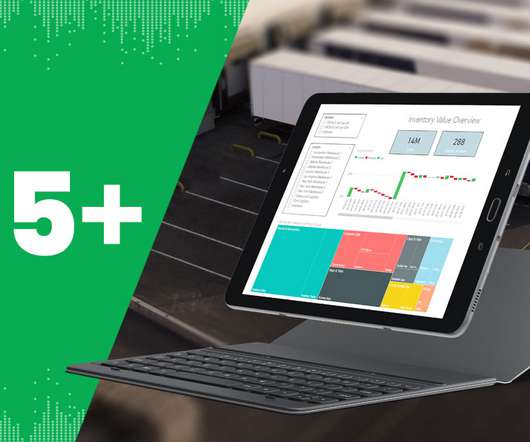
SaaS Dashboard Examples For Modern Business Management Practices

datapine

Software as a service (SaaS) has blossomed in the last five years, and the public SaaS market is expected to grow to $76 billion by the year 2020, according to FinancesOnline. That’s where SaaS dashboards enter the fold. Exclusive Bonus Content: Your Definitive Guide to SaaS & Dashboards! What Is A SaaS Dashboard?

Insiders

Sign Up for our Newsletter

This site is protected by reCAPTCHA and the Google Privacy Policy and Terms of Service apply.

Trending Sources

article thumbnail

Top 25+ Retail KPIs and Metrics for 2020 Reporting

Jet Global

What is a Retail KPI? A retail Key Performance Indicator (KPI) or metric is a clearly defined and quantifiable measure that can be used to assess the performance of a retail business. To help business owners with their analytics, we recommend the use of a retail KPI dashboard. How to Build Retail KPI Dashboards.

Metrics 64
article thumbnail

28 Best Insurance KPIs and Metrics Examples for 2020 Reporting

Jet Global

What Is an Insurance KPI? An insurance Key Performance Indicator (KPI) or metric is a measure that an insurance company uses to monitor its performance and efficiency. These KPIs are often used to compare companies in the insurance industry against each other to see which would be a better investment. View Guide Now.

article thumbnail

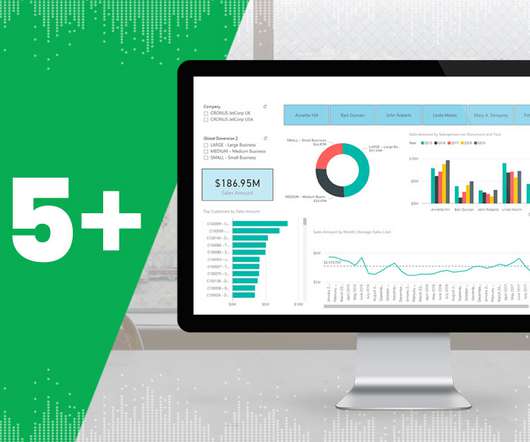
Top 35+ Distribution KPIs and Metric Examples for 2020 Reporting

Jet Global

What Is a Distribution KPI? A distribution Key Performance Indicator (KPI) or metric is a measure that a company in the distribution sector uses to monitor its performance and efficiency. As such, this post will go over distribution KPI examples that cover operational, lean, and financial performance. View Guide Now.

Metrics 52
article thumbnail

Discover The Power Of Modern Performance Reports – See Examples & Best Practices 

datapine

These analytical tools allow decision-makers to get a sense of their performance in a number of areas and extract valuable insights to inform their future strategies and boost growth. To help you get started with the topic, we put together this insightful guide on modern performance reporting using professional online dashboards.

Reporting 207
article thumbnail

A Data-Driven Guide To Skyrocket Your Year Over Year Growth

datapine

Year over year growth is a KPI that allows you to measure and benchmark your progress against a comparison period of 12 months before. Further, this monthly data can be rolled up into a number chart that summarizes the overall year-over-year growth rate in a financial dashboard. What Is YoY Growth?