article thumbnail

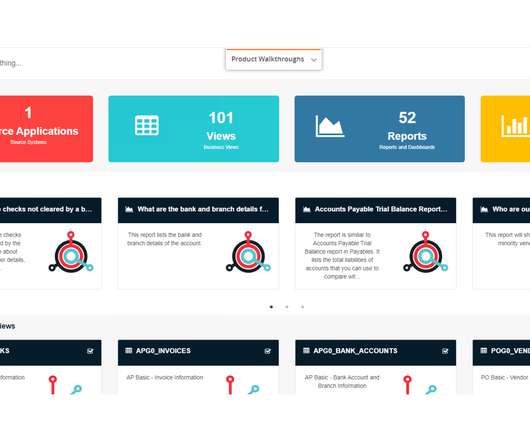
Checklist of Data Dashboard for 2021? Definition, Examples & More

FineReport

Want to flee the great tidal wave of data display? Now here comes data dashboard ?Similar What is Data Dashboard?–Definition. A data dashboard is a useful tool that could display and analyze users’ complex data by means of data visualization so that the user gains a deep insight into the value of data.

article thumbnail

BI Visualization Tools: Top 5 Picks 2021

FineReport

By definition, BI tools always cover the feature of data visualization. BI visualization takes data and converts them into visual charts, graphs, dashboards, and tables. Thus, business analysts can detect hidden patterns, trends, or correlations in data. Dashboard (by FineReport). Google Data Studio.

Insiders

Sign Up for our Newsletter

This site is protected by reCAPTCHA and the Google Privacy Policy and Terms of Service apply.

article thumbnail

Feeding America turns to data to feed the hungry

CIO Business Intelligence

We want to be a data-first organization, and to really drive impact through insights, you need a centralized place to store and analyze the data.”. MealConnect’s new produce features launched in August 2021. Byrdak’s team connected it to individual food bank ERP platforms to deliver dashboards on food sourcing and distribution.

article thumbnail

Low code/no code tools reap IT benefits—with caveats

CIO Business Intelligence

A September 2021 Gartner report predicted that by 2025, 70% of new applications developed by enterprises will use low-code or no-code technologies, up from less than 25% in 2020. At Fivetran, an analytics group prepares the marketing effectiveness dashboards used by the rest of the organization.

IT 119
article thumbnail

Top 5 Report Maker Software & Reporting Software

FineReport

It has been recognized in the Honorable Mention of the 2021 Gartner Magic Quadrant for Analytics and Business Intelligence Platforms. On top of these, FineReport’s data visualization package offers a wide variety of visualization options such as 3D charts, maps, GIS relationships, dashboards. Source: Agency Analytics.

article thumbnail

The DataOps Vendor Landscape, 2021

DataKitchen

Download the 2021 DataOps Vendor Landscape here. DataOps is a hot topic in 2021. This is not surprising given that DataOps enables enterprise data teams to generate significant business value from their data. QuerySurge – Continuously detect data issues in your delivery pipelines. Production Monitoring Only.

Testing 300
article thumbnail

Top Business Intelligence Features To Boost Your Business Performance

datapine

a) Data Connectors Features. c) Dashboard Features. For a few years now, Business Intelligence (BI) has helped companies to collect, analyze, monitor, and present their data in an efficient way to extract actionable insights that will ensure sustainable growth. b) Flexible Data Integration. 3) Dashboards.