Remove 2023 Remove Data Warehouse Remove Forecasting Remove Visualization
article thumbnail

Enhance monitoring and debugging for AWS Glue jobs using new job observability metrics, Part 3: Visualization and trend analysis using Amazon QuickSight

AWS Big Data

QuickSight makes it straightforward for business users to visualize data in interactive dashboards and reports. QuickSight periodically runs Amazon Athena queries to load query results to SPICE and then visualize the latest metric data. The filtered Worker Utilization per Job visualization shows 0.5,

Metrics 111
article thumbnail

Financial Dashboard: Definition, Examples, and How-tos

FineReport

A financial dashboard, one of the most important types of data dashboards , functions as a business intelligence tool that enables finance and accounting teams to visually represent, monitor, and present financial key performance indicators (KPIs). You can download FineReport for free and have a try! Free Download of FineReport 1.

Insiders

Sign Up for our Newsletter

This site is protected by reCAPTCHA and the Google Privacy Policy and Terms of Service apply.

article thumbnail

BMW Cloud Efficiency Analytics powered by Amazon QuickSight and Amazon Athena

AWS Big Data

It seamlessly consolidates data from various data sources within AWS, including AWS Cost Explorer (and forecasting with Cost Explorer ), AWS Trusted Advisor , and AWS Compute Optimizer. They can use their own toolsets or rely on provided blueprints to ingest the data from source systems.

article thumbnail

Top Business Intelligence Features To Boost Your Business Performance

datapine

billion , paired with the fact that 33% of large-sized businesses will practice decision intelligence by 2023. Through powerful data visualizations, managers and team members can get a bigger picture of their performance to optimize their processes and ensure healthy project development. c) Join Data Sources. 1) Connect.

article thumbnail

10+ Government KPIs for 2023 Reporting

Jet Global

Your KPIs should be a mix of: Leading and lagging metrics : Ensure that you have both predictive (leading) and corrective (lagging) measures to forecast and report performance, respectively. To aid you in this task, we have created a KPI dashboard that will help you visualize your data and customize your reporting format.

article thumbnail

insightsoftware Recognized in Gartner’s Magic Quadrant for Financial Planning

Jet Global

insightsoftware is thrilled to be recognized as a Niche Player in Gartner’s 2023 Magic Quadrant (MQ) for Financial Planning Software. Our financial planning tools are highly flexible and can be fully customized to meet your organization’s specific planning and forecasting needs. What is the Gartner Magic Quadrant?

article thumbnail

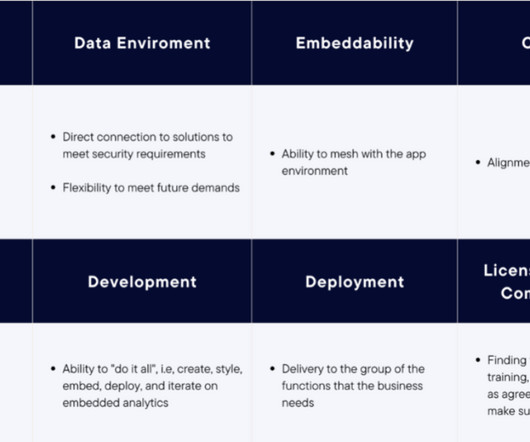
Growth and Achievement for insightsoftware’s Embedded Analytics

Jet Global

This was bolstered by insightsoftware’s acquisition of Dundas Data Visualization, Inc., adding deeper functionality that has strengthened Logi’s self-service data analytics and visualizations. What’s Next For 2023. One new initiative for 2023 will be the launch of our Embedded Analytics Customer Advisory Board.