article thumbnail

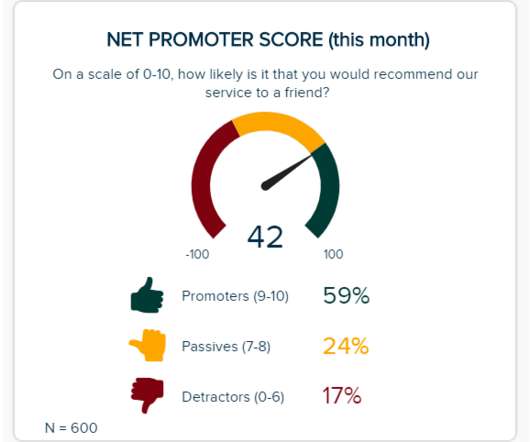
Take Advantage Of The Best Interactive & Effective Data Visualization Examples

datapine

Table of Contents 1) The Benefits Of Data Visualization 2) Our Top 27 Best Data Visualizations 3) Interactive Data Visualization: What’s In It For Me? 4) Static vs. Animated Data Visualization Data is the new oil? ” – David McCandless Humans are visual creatures. No, data is the new soil.”

article thumbnail

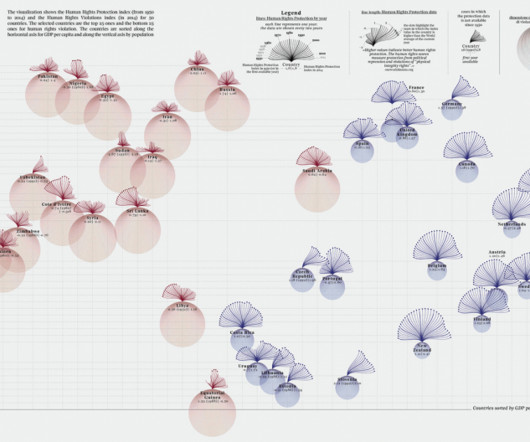
Remove Your Rose Tinted Glasses: Data Visualizations Designed to Mislead

datapine

1) Misleading Data Visualization Examples. 2) How to Avoid Misleading Visuals. 3) The Impact Of Bad Data Visualizations. But while that may be the case, people are duped by data visualizations every day. Bad data visualizations come in many forms, with some more obvious than others. Table of Contents.

Insiders

Sign Up for our Newsletter

This site is protected by reCAPTCHA and the Google Privacy Policy and Terms of Service apply.

Trending Sources

article thumbnail

Why Do You Need To Visualize Your Accounting Reports?

datapine

5) The Role Of Visuals In Accountant Reports. Explore our 14 day free trial & benefit from great accounting reports! We will cover this more in detail later in the post with a few financial dashboard examples, but first, let’s look at the main benefits coming from these analytical tools. Table of Contents.

article thumbnail

Master Your Analytics Challenges With Professional Embedded BI Tools

datapine

3) The Link Between White Label BI & Embedded Analytics 4) An Embedded BI Workflow Example 5) White Labeled Embedded BI Examples In the modern world of business, data holds the key to success. That said, data and analytics are only valuable if you know how to use them to your advantage. million per year.

Analytics 191
article thumbnail

Your Guide To Modern Agency Analytics, Dashboards & Reporting Techniques

datapine

The answer is modern agency analytics reports and interactive dashboards. In this article, we will cover every fundamental aspect to take advantage of agency analytics. Starting with its definition, following with the benefits of agency reports, a list of tools, and a set of agency dashboard examples. What Are Agency Analytics?

article thumbnail

Data Visualization and Visual Analytics: Seeing the World of Data

Sisense

Our BI Best Practices demystify the analytics world and empower you with actionable how-to guidance. In a world increasingly dominated by data, users of all kinds are gathering, managing, visualizing, and analyzing data in a wide variety of ways. Data visualization: painting a picture of your data.

article thumbnail

Augmented Analytics Provides Benefits to Data Scientists!

Smarten

When an enterprise undertakes an Augmented Analytics project, it is typically doing so because it wishes to initiate data democratization, improve data literacy among its team members and create Citizen Data Scientists. Let’s consider some of the benefits and advantages inherent in Data Scientist use of Augmented Analytics solutions.