Remove Analytics Remove Interactive Remove Key Performance Indicator Remove Predictive Analytics
article thumbnail

Do I Need Both BI Tools and Augmented Analytics?

Smarten

Why You Need Both BI Tools and Augmented Analytics and What to Consider When Selecting a Vendor ! Social BI Tools that allow for sharing of data, alerts, dashboards and interactivity to support decisions, enable online communication and collaboration. Business Intelligence. Dashboards.

article thumbnail

Make Your Investment in Analytic Technology Pay Off With Decision Requirements Modeling

Decision Management Solutions

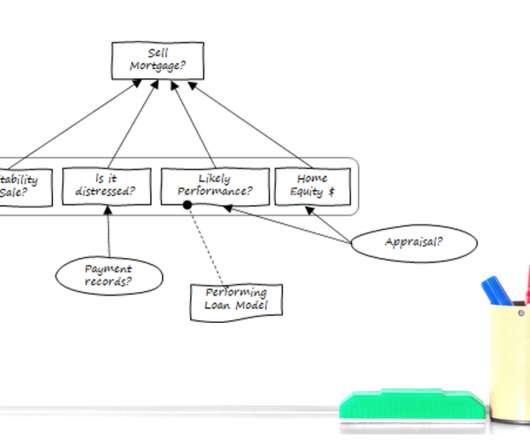
Like many enterprises, you’ve likely made a hefty investment in analytic technology—from interactive dashboards and advanced visualization tools to data mining, predictive analytics, machine learning (ML), and artificial intelligence (AI). Limitations of common approaches to analytic projects.

Insiders

Sign Up for our Newsletter

This site is protected by reCAPTCHA and the Google Privacy Policy and Terms of Service apply.

Trending Sources

article thumbnail

Smarten Announces SnapShot Anomaly Monitoring Alerts: Powerful Tools for Business Users!

Smarten

Smarten announces the launch of SnapShot Anomaly Monitoring Alerts for Smarten Augmented Analytics. SnapShot Monitoring provides powerful data analytical features that reveal trends and anomalies and allow the enterprise to map targets and adapt to changing markets with clear, prescribed actions for continuous improvement.

article thumbnail

How To Improve Your Facility Management With Healthcare Reports

datapine

Like many of today’s most important industries, digital data, metrics and KPIs (key performance indicators) are a part of a bright and prosperous future – and a comprehensive healthcare report has the power to deliver in each of these critical areas. Preventative management. Disease monitoring.

Reporting 198
article thumbnail

Conversational AI use cases for enterprises

IBM Big Data Hub

The emergence of NLG has dramatically improved the quality of automated customer service tools, making interactions more pleasant for users, and reducing reliance on human agents for routine inquiries. These technologies enable systems to interact, learn from interactions, adapt and become more efficient. billion by 2030.

article thumbnail

Analytics On The Bleeding Edge: Transforming Data's Influence

Occam's Razor

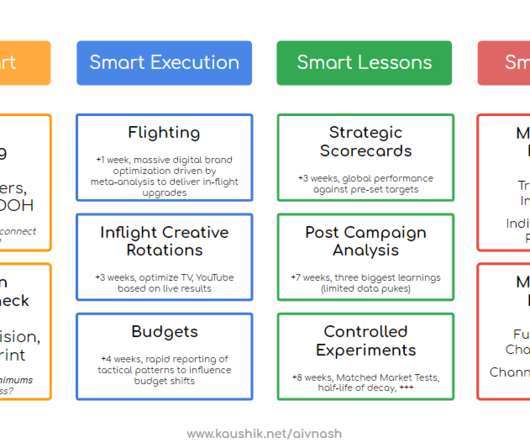
Analytics teams are named for the silos and limitations within which they trap themselves. The other dimension to consider is most Analtyics teams kick into gear after the campaign is concluded, after the customer interaction has taken place in the call center, and after the funds budgeted have already been spent. Paid Media.

Analytics 131
article thumbnail

An Introduction To Data Dashboards: Meaning, Definition & Industry Examples

datapine

Exclusive Bonus Content: Ready to make analytics straightforward? Data dashboards provide a centralized, interactive means of monitoring, measuring, analyzing, and extracting a wealth of business insights from relevant datasets in several key areas while displaying aggregated information in a way that is both intuitive and visual.