Remove Article Remove Dashboards Remove Data Collection Remove Statistics
article thumbnail

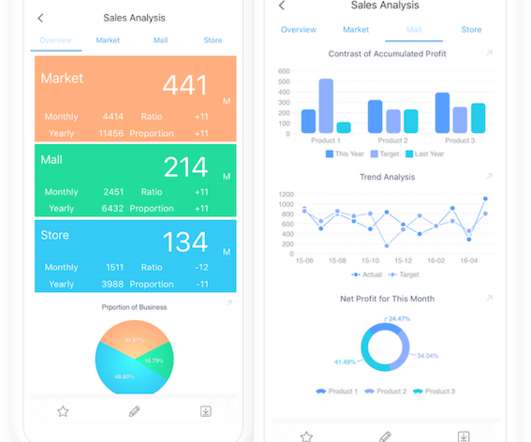
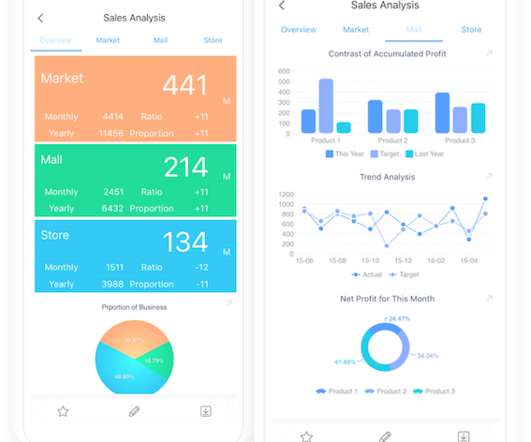
Mastering Data Analysis Report and Dashboard

FineReport

As we explore examples of data analysis reports and interactive report data analysis dashboards, we embark on a journey to unravel the nuanced art of transforming raw data into meaningful narratives that empower decision-makers. This will be elaborated on in the third part of this article. Try FineReport Now 1.1

article thumbnail

What is IoT Dashboard?

FineReport

Among the tools that have emerged from this digital transformation, IoT dashboards stand out as invaluable assets. In this article, we will explore the concept of IoT dashboards, delve into their benefits, examine real-life examples, and highlight the essential features that make them indispensable in the IoT landscape.

IoT 52
Insiders

Sign Up for our Newsletter

This site is protected by reCAPTCHA and the Google Privacy Policy and Terms of Service apply.

article thumbnail

Mobile Data Collection: What it is and what it can do

FineReport

Data collection is nothing new, but the introduction of mobile devices has made it more interesting and efficient. But now, mobile data collection means information can be digitally recording on the mobile device at the source of its origin, eliminating the need for data entry after the information is collected.

article thumbnail

Why Nonprofits Shouldn’t Use Statistics

Depict Data Studio

Today’s article comes from Maryfrances Porter, Ph.D. & — Thank you to Ann Emery, Depict Data Studio, and her Simple Spreadsheets class for inviting us to talk to them about the use of statistics in nonprofit program evaluation! . Why Nonprofits Shouldn’t Use Statistics. & Alison Nagel, Ph.D And here’s why!

article thumbnail

Mobile Data Collection: What it is and what it can do

FineReport

Data collection is nothing new, but the introduction of mobile devices has made it more interesting and efficient. But now, mobile data collection means information can be digitally recording on the mobile device at the source of its origin, eliminating the need for data entry after the information is collected.

article thumbnail

A Guide To The Methods, Benefits & Problems of The Interpretation of Data

datapine

2) How To Interpret Data? 3) Why Data Interpretation Is Important? 4) Data Analysis & Interpretation Problems. 5) Data Interpretation Techniques & Methods. 6) The Use of Dashboards For Data Interpretation. Business dashboards are the digital age tools for big data.

article thumbnail

A history of tech adaptation for today’s changing business needs

CIO Business Intelligence

The first was becoming one of the first research companies to move its panels and surveys online, reducing costs and increasing the speed and scope of data collection. Additionally, it continuously explores reams of data and modern tools to improve its capabilities and adapt to the changing data landscape.