Remove Big Data Remove Dashboards Remove Data Processing Remove Visualization
article thumbnail

10 Examples of How Big Data in Logistics Can Transform The Supply Chain

datapine

Table of Contents 1) Benefits Of Big Data In Logistics 2) 10 Big Data In Logistics Use Cases Big data is revolutionizing many fields of business, and logistics analytics is no exception. The complex and ever-evolving nature of logistics makes it an essential use case for big data applications.

Big Data 275
article thumbnail

The Top 20 Data Visualization Books That Should Be On Your Bookshelf

datapine

Previously, we discussed the top 19 big data books you need to read, followed by our rundown of the world’s top business intelligence books as well as our list of the best SQL books for beginners and intermediates. Data visualization, or ‘data viz’ as it’s commonly known, is the graphic presentation of data.

Insiders

Sign Up for our Newsletter

This site is protected by reCAPTCHA and the Google Privacy Policy and Terms of Service apply.

Trending Sources

article thumbnail

An Introduction To Data Dashboards: Meaning, Definition & Industry Examples

datapine

Enter data dashboards – one of history’s best innovations in business intelligence. To help you understand this notion in full, we’re going to explore a data dashboard definition, explain the power of dashboard data, and explore a selection of data dashboard examples. What Is A Data Dashboard?

article thumbnail

Big Data is Transforming the Future of WordPress Hosting

Smart Data Collective

Forbes contributor Kalev Leetaru recently wrote a fantastic article about the intersection of big data and website hosting. Leetaru notes that big data and cloud technology have led to the evolution of web hosting services. Cloud technology is changing the logistics of many traditional hosting plans.
article thumbnail

Enhance monitoring and debugging for AWS Glue jobs using new job observability metrics, Part 3: Visualization and trend analysis using Amazon QuickSight

AWS Big Data

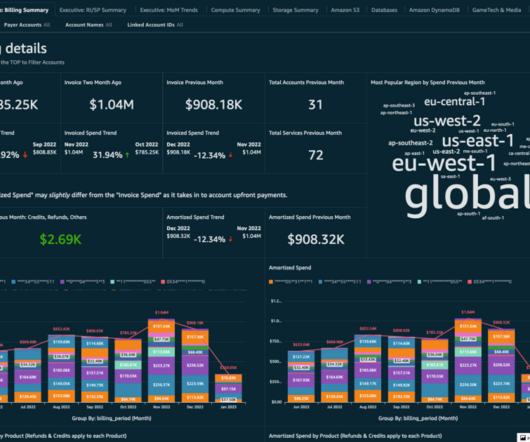
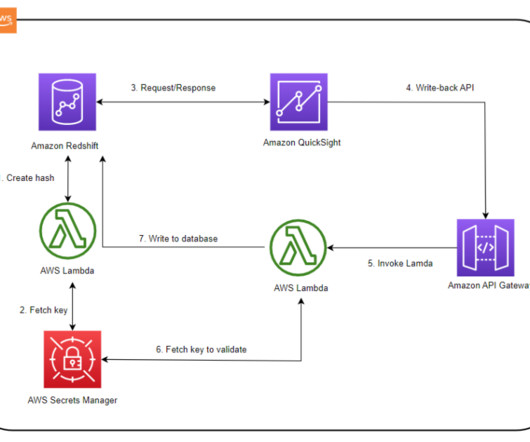
Grafana provides powerful customizable dashboards to view pipeline health. QuickSight makes it straightforward for business users to visualize data in interactive dashboards and reports. QuickSight makes it straightforward for business users to visualize data in interactive dashboards and reports.
Metrics 104
article thumbnail

Get Started With Business Performance Dashboards – Examples & Templates

datapine

That said, if you’re looking to evolve your empire, increase brand awareness, and boost your bottom line, embracing business performance dashboards and big data should be at the top of your priority list. The Link Between Data And Business Performance. What Is A Performance Dashboard In Business? Still unsure?

article thumbnail

Utilize The Potential Of Digital Dashboards In A Business Environment

datapine

“Without big data analytics, companies are blind and deaf, wandering out onto the web like deer on a freeway.” – Geoffrey Moore. And, as a business, if you use your data wisely, you stand to reap great rewards. Data brings a wealth of invaluable insights that could significantly boost the growth and evolution of your business.