article thumbnail

Build Up Your Performance With KPI Scorecards – Examples & Templates

datapine

Tracking the success metrics based on your needs, and the time frame you select while comparing your values can be done with simple yet effective scorecards. What Is A KPI Scorecard? A KPI scorecard is a term used to describe a statistical record that measures progress or achievement towards a set performance indicator.

Scorecard 226
article thumbnail

Gaining Control of Your CDP Environment

Cloudera

With each blog we’ll outline the symptoms and root causes of common environmental health challenges and prescribe solutions. When we conclude the series, we’ll share a homegrown tool, an environmental health scorecard, to monitor and manage the health of your environment. That’s observability. Let the healing begin!

Insiders

Sign Up for our Newsletter

This site is protected by reCAPTCHA and the Google Privacy Policy and Terms of Service apply.

Trending Sources

article thumbnail

A Complete Guide To Driving Digital Transformation In Marketing

datapine

Several marketing dashboard tools allow you to generate automated online dashboards and reports to track your most relevant KPIs in one place. The image above is an example of a scorecard report tracking the performance of 4 social channels. The value of this tool lies in its visual nature.

article thumbnail

A Beginner’s Guide To Inventory Metrics And Best Practices

datapine

In the matter, data analysis and dashboard designer software is a precious ally. We will finish by presenting a business dashboard that will show how those metrics work together when depicting an inventory data-story. Inventory Metrics Examples On Dynamic Dashboards. a) Inventory analytics dashboard for supply chain.

Metrics 286
article thumbnail

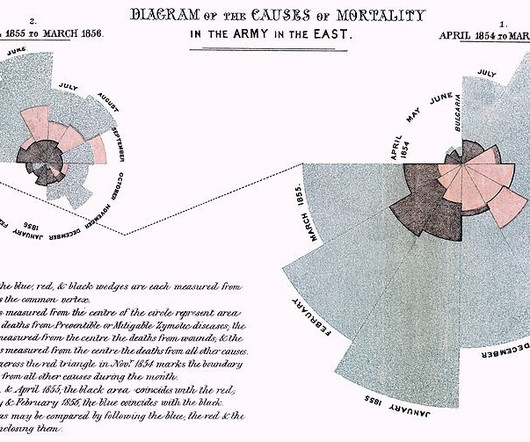
A Brief History of Data Visualization

Jet Global

Editors note: This blog was originally published in October 2013, and has been completely revamped and updated for accuracy, relevancy, and comprehensiveness in September 2019 Prior to the 17th century, data visualization existed mainly in the realm of maps, displaying land markers, cities, roads, and resources.

article thumbnail

10 Ways That Corporate Dashboards Can Make Your Enterprise Life Easier

datapine

Whatever your sector or niche, if you want to remain adaptable and get one step ahead of the competition, working with the right data-driven tools and utilizing a corporate dashboard is essential. That’s where corporate dashboards come in. Your Chance: Want to create your own dynamic corporate dashboard? 1) CFO dashboard.

article thumbnail

A Complete Guide On How To Set Smart KPI Targets And Goals

datapine

Online dashboard tools make this possible by providing a centralized view of all your most relevant KPIs to make informed decisions considering the full picture. This dashboard provides details into all of these areas and compares your current performance to the target, letting you easily spot if you are meeting your expected outcomes or not.

KPI 152