Remove Book Remove Experimentation Remove Metrics Remove Statistics
article thumbnail

Bringing an AI Product to Market

O'Reilly on Data

The first step in building an AI solution is identifying the problem you want to solve, which includes defining the metrics that will demonstrate whether you’ve succeeded. It sounds simplistic to state that AI product managers should develop and ship products that improve metrics the business cares about. Agreeing on metrics.

Marketing 362
article thumbnail

The Lean Analytics Cycle: Metrics > Hypothesis > Experiment > Act

Occam's Razor

To win in business you need to follow this process: Metrics > Hypothesis > Experiment > Act. We are far too enamored with data collection and reporting the standard metrics we love because others love them because someone else said they were nice so many years ago. That metric is tied to a KPI. But it is not routine.

Metrics 156
Insiders

Sign Up for our Newsletter

This site is protected by reCAPTCHA and the Google Privacy Policy and Terms of Service apply.

Trending Sources

article thumbnail

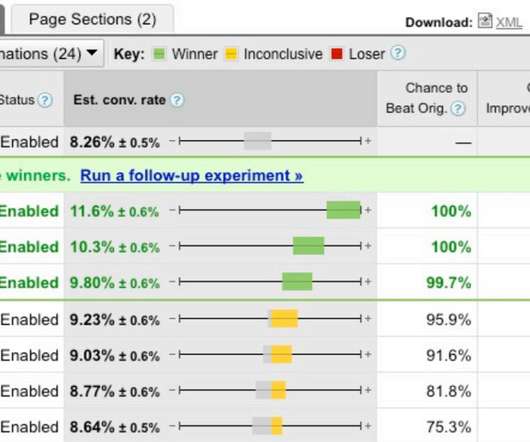
Robust Experimentation and Testing | Reasons for Failure!

Occam's Razor

Since you're reading a blog on advanced analytics, I'm going to assume that you have been exposed to the magical and amazing awesomeness of experimentation and testing. There are fat books to teach you how to experiment ( or die! What does a robust experimentation program contain? It truly is the bee's knees.

article thumbnail

Variance and significance in large-scale online services

The Unofficial Google Data Science Blog

Unlike experimentation in some other areas, LSOS experiments present a surprising challenge to statisticians — even though we operate in the realm of “big data”, the statistical uncertainty in our experiments can be substantial. We must therefore maintain statistical rigor in quantifying experimental uncertainty.

article thumbnail

Understanding Simpson’s Paradox to Avoid Faulty Conclusions

Sisense

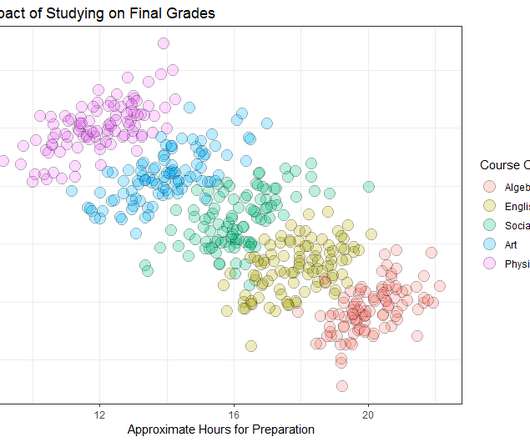
One of the simplest ways to start exploring your data is to aggregate the metrics you are interested in by their relevant dimensions. This is an example of Simpon’s paradox , a statistical phenomenon in which a trend that is present when data is put into groups reverses or disappears when the data is combined.

Testing 104
article thumbnail

Knowledge

Occam's Razor

" ~ Web Metrics: "What is a KPI? " + Standard Metrics Revisited Series. Book Articles. "Engagement" Is Not A Metric, It's An Excuse. Defining a "Master Metric", + a Framework to Gain a Competitive Advantage in Web Analytics. Experimentation and Testing: A Primer.

KPI 124
article thumbnail

Analytics On The Bleeding Edge: Transforming Data's Influence

Occam's Razor

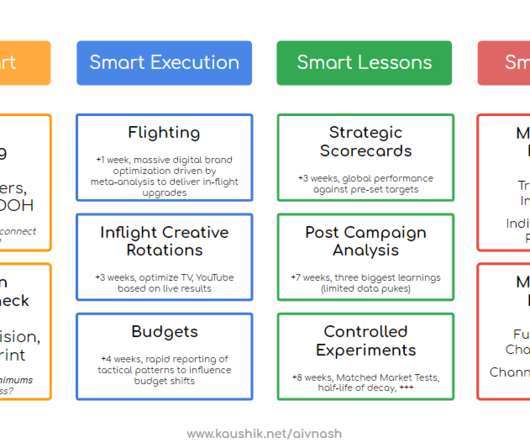
This is very hard to do, we now have a proven seven-step experimentation process, with one of the coolest algorithms to pick matched-markets (normally the kiss of death of any large-scale geo experiment). The benchmark for the beautiful metric AVOC is 15.3%. What does the diminishing returns curve look like for TV GRPs for our company?

Analytics 131