Remove Broadcasting Remove Business Intelligence Remove Modeling Remove Visualization
article thumbnail

Sport analytics leverage AI and ML to improve the game

CIO Business Intelligence

Risk Mitigation Modeling can then be used to analyze training data and determine a player’s ideal training volume while minimizing injury risk. The great thing about the app is it’s very visual and it also has a reasonable amount of customization.” Souza’s advice: Cultivate curiosity. Bruno’s advice: Create a multidisciplinary team.

article thumbnail

P&G enlists IoT, predictive analytics to perfect Pampers diapers

CIO Business Intelligence

To address these issues, Proctor & Gamble worked closely with Microsoft to deploy Microsoft’s IoT and Edge analytics platform, its Azure cloud for manufacturing, and its IoT sensors, edge analytics, and machine learning models. Data is streamed to Microsoft’s Edge analytics model using a broadcasting system and Grafana pre-visualization.

Insiders

Sign Up for our Newsletter

This site is protected by reCAPTCHA and the Google Privacy Policy and Terms of Service apply.

article thumbnail

Gen AI’s ultimate potential? Hive mind teamwork

CIO Business Intelligence

By the time information slogged through every layer of our hierarchical operating model, all comparative advantages were lost. The enemy’s model, however, amplified the power of their bargain-bin tech. I believe large language models (LLMs) will prompt most organizations to face the same reckoning. Our solution?

article thumbnail

Micro transformation: Driving big business benefit through quick IT wins

CIO Business Intelligence

So IT did a micro transformation dubbed “eCampus,” leveraging the existing framework for online education via a shared services model. On the back end, that required “some plumbing” using Cisco Webex to broadcast the faculty member across a larger footprint. That means if a class can be online, students want that option.

IT 76
article thumbnail

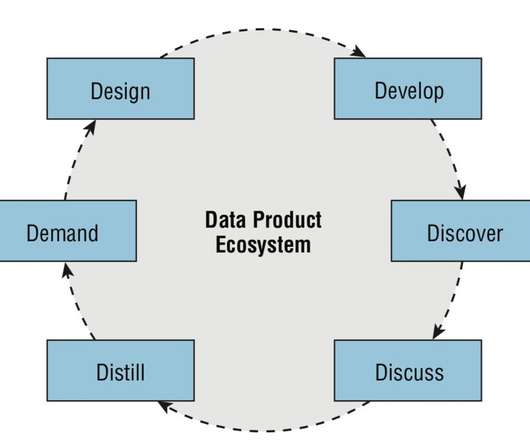
Keys to Data Fluency: Creating the Data Product Ecosystem

Juice Analytics

Tools gather data, visualize the results, and distribute data products to users. This model will reveal data product concepts with the potential to deliver the greatest impact. Less than 30 percent of the potential users of organizations’ standard business intelligence (BI) tools use the technology today.

article thumbnail

Misleading Statistics Examples – Discover The Potential For Misuse of Statistics & Data In The Digital Age

datapine

In the digital age, these capabilities are only further enhanced and harnessed through the implementation of advanced technology and business intelligence software. 4) Misleading data visualization. Whatever the types of data visualization you choose to use, it must convey: – The scales used.