

Business Intelligence Dashboard (BI Dashboard): Best Practices and Examples
FineReport
APRIL 11, 2023
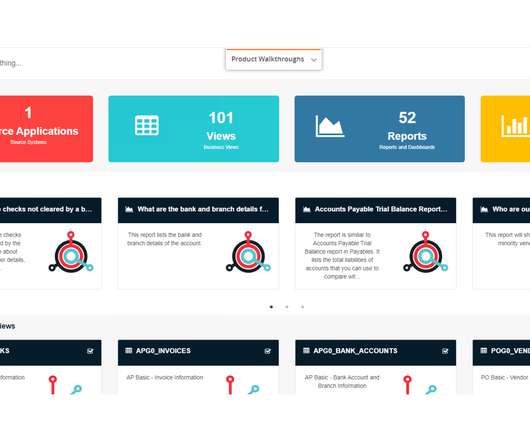
Additionally, they provide tabs, pull-down menus, and other navigation features to assist in accessing data. Data Visualizations : Dashboards are configured with a variety of data visualizations such as line and bar charts, bubble charts, heat maps, and scatter plots to show different performance metrics and statistics.


Let's personalize your content