Remove Business Analytics Remove Interactive Remove Sales Remove Visualization
article thumbnail

Accessible Business Analytics Set to Be a Boon for Small Businesses

Smart Data Collective

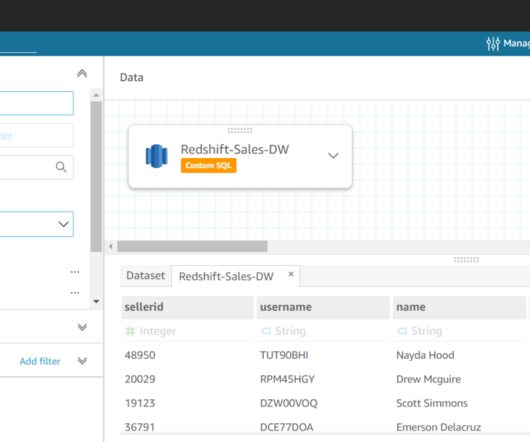
Modern business intelligence platforms can integrate with hundreds of data sources like marketing communication tools, ecommerce platforms and payment providers to create this holistic picture. Business leaders can then consolidate whatever performance metrics matter most to them into dedicated interactive dashboards and dynamic reports.

article thumbnail

Master Data Visualization Techniques: A Comprehensive Guide

FineReport

Data visualization techniques are paramount in today’s data-driven world. Mastering data visualization techniques is not just a skill but a necessity for professionals across various industries. Definition and Importance Visualizing data involves representing information through graphical elements like charts and graphs.

Insiders

Sign Up for our Newsletter

This site is protected by reCAPTCHA and the Google Privacy Policy and Terms of Service apply.

article thumbnail

Take Advantage Of The Top 16 Sales Graphs And Charts To Boost Your Business

datapine

As the head of sales at your small company, you’ve prepared for this moment. “Mr. Feritta, what’s the number one mistake you see small businesses making in the modern economy?”. Download our free executive summary and boost your sales strategy! 1) Sales Performance. What do you wanna know?”. Tilman pauses for a second.

Sales 235
article thumbnail

Take Advantage Of Operational Metrics & KPI Examples – A Comprehensive Guide

datapine

We have written about management reporting methods that can be utilized in the modern practice of creating powerful analysis, bringing complex data into simple visuals, and employ them to make actionable decisions. Your Chance: Want to visualize & track operational metrics with ease? How To Select Operational Metrics And KPIs?

KPI 269
article thumbnail

Join me at Live! 360 Orlando to learn more about Applied Business Analytics

Jen Stirrup

360 Orlando and I’m presenting a workshop on From Business Intelligence to Business Analytics with the Microsoft Data Platform. Data becomes relevant for decision making when we start to use it properly, so this workshop will demonstrate the use of analytics for real-life use cases. Power BI and Marketing Data.

article thumbnail

A Guide To The Methods, Benefits & Problems of The Interpretation of Data

datapine

Through the art of streamlined visual communication, data dashboards permit businesses to engage in real-time and informed decision-making and are key instruments in data interpretation. Typically, quantitative data is measured by visually presenting correlation tests between two or more variables of significance.

article thumbnail

Automate deployment of an Amazon QuickSight analysis connecting to an Amazon Redshift data warehouse with an AWS CloudFormation template

AWS Big Data

Amazon Redshift is the most widely used data warehouse in the cloud, best suited for analyzing exabytes of data and running complex analytical queries. Amazon QuickSight is a fast business analytics service to build visualizations, perform ad hoc analysis, and quickly get business insights from your data.