article thumbnail

Creating Interactive and Animated Charts with ipyvizzu

Analytics Vidhya

Introduction Data visualization (DV) plays a crucial role in analyzing and interpreting data. With the growing importance of data science and machine learning, data analysis holds a special place in […] The post Creating Interactive and Animated Charts with ipyvizzu appeared first on Analytics Vidhya.

article thumbnail

How to Create Stunning and Interactive Dashboards in Excel?

Analytics Vidhya

The post How to Create Stunning and Interactive Dashboards in Excel? appeared first on Analytics Vidhya. This article was published as a part of the Data Science Blogathon Introduction I have been using Pandas with Python and Plotly to create some of the most stunning dashboards for my projects. I […].

Insiders

Sign Up for our Newsletter

This site is protected by reCAPTCHA and the Google Privacy Policy and Terms of Service apply.

article thumbnail

Getting Started with Data Analysis using Power BI

Analytics Vidhya

Microsoft‘s business analytics product, Power BI, delivers interactive data visualization BI capabilities that allow users to see and share data and insights throughout their organisation. Power BI provides insight data by using data interactively and exploring it by visualizations. […].

article thumbnail

Accessible Business Analytics Set to Be a Boon for Small Businesses

Smart Data Collective

Modern business intelligence platforms can integrate with hundreds of data sources like marketing communication tools, ecommerce platforms and payment providers to create this holistic picture. Business leaders can then consolidate whatever performance metrics matter most to them into dedicated interactive dashboards and dynamic reports.

article thumbnail

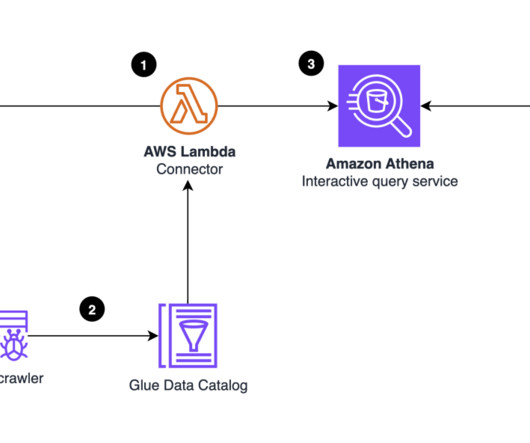
Visualize Amazon DynamoDB insights in Amazon QuickSight using the Amazon Athena DynamoDB connector and AWS Glue

AWS Big Data

Athena is a serverless, interactive service that allows you to query data from a variety of sources in heterogeneous formats, with no provisioning effort. Finally, to visualize BI insights, you can use Amazon QuickSight , a cloud-powered business analytics service. Choose Create data source.

article thumbnail

Top Business Intelligence Features To Boost Your Business Performance

datapine

Business intelligence tools provide you with interactive BI dashboards that serve as powerful communication tools to keep teams engaged and connected. Through powerful data visualizations, managers and team members can get a bigger picture of their performance to optimize their processes and ensure healthy project development.

article thumbnail

Tax Reports Not Making Cents? Visualizations Are Your Friend

Jet Global

Inability to see interactions between your financial and nonfinancial data makes it much harder to tell the story behind the numbers. Step 2: Communicate Your Tax Analyses More Effectively with Dashboards and Visualizations. Make clear, easy-to-understand visual reports that bring your tax data to life for anyone.